Data Science Tutorials
Data science is an interdisciplinary field that applies information from data across a wide range of application fields by using scientific methods, procedures, algorithms, and systems to infer knowledge and insights from noisy, structured, and unstructured data.
Data visualization libraries like matplotlib, Bokeh, bqplot, Plotnine, cufflinks, Altair, hvplot, Holoviews, seaborn and more.
Different Interactive charts Sunburst Charts, Sankey Diagrams (Alluvial), Candlestick Charts, Network Charts, Chord Diagram, Parallel Coordinates Plots, Radar Charts, Connection Map, Treemap, Choropleth Maps, Scatter & Bubble Maps.
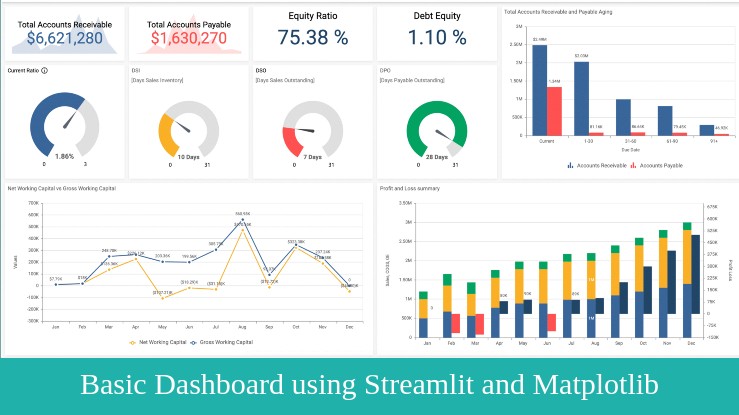
Apart from this, you will find tutorials about time series data and its applications, creating dashboards, and other concepts.
For an in-depth understanding of the above concepts, check out the sections below.

 Sunny Solanki


%20API%20to%20Understand%20Statistical%20Relations%20between%20Multiple%20Data%20Variables.jpg)


%20to%20Interactive.jpg)


.jpg)


.jpg)


.jpg)

