Treemap in Python (plotly)
Treemap are quite common ways to see the distribution of quantities with hierarchical structures. We have many situations where data is hierarchical like population by country/continent, market capitalization by sector/company, area distribution by country/continent, etc. We need an efficient way to represent this data so that we can analyze distribution down to a few layers of hierarchy. We'll be explaining how to draw treemaps using few examples below using plotly as our primary library.
import pandas as pd
import numpy as np

import plotly.express as px
Loading Datasets
We'll start the loading list of below datasets which will be used for plotting treemap.
district_wise_population = pd.read_csv("datasets/indian-census-data-with-geospatial-indexing/district wise population and centroids.csv")
district_wise_population["Country"] = "India"
district_wise_population.head()
world_data = pd.read_csv("datasets/countries of the world.csv")
world_data.head()
starbucks_stores = pd.read_csv("datasets/starbucks_store_locations.csv")
starbucks_stores = starbucks_stores.groupby(["Country","State/Province","City"]).count()[["Store Number"]].rename(columns={"Store Number":"Count"})
starbucks_stores = starbucks_stores.reset_index()

starbucks_stores.head()
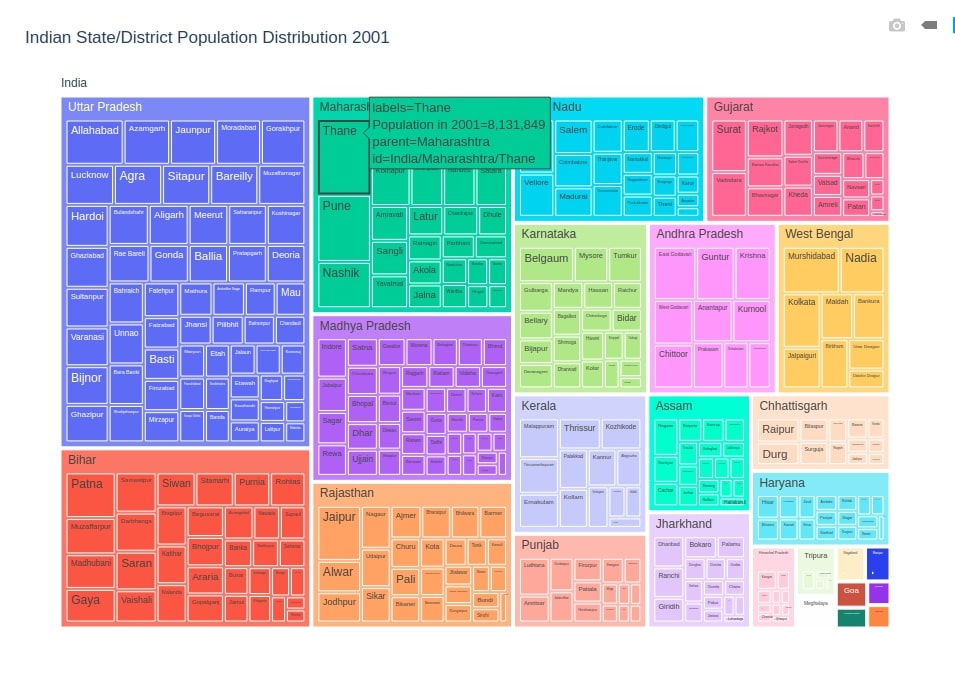
Indian State/District Population Distribution 2001 Treemap
Our first treemap consists of the population distribution of India per state per district for the year 2001. We have used 3 layers of hierarchical data here ['Country', 'State', 'District']. We need to pass categorical columns to path attribute whereas numerical column to values attribute to get a distribution of values by path hierarchy.
fig = px.treemap(district_wise_population,
                 path=['Country', 'State', 'District'],
                 values='Population in 2001')

fig.update_layout(title="Indian State/District Population Distribution 2001",
                  width=1000, height=700,)

fig.show()
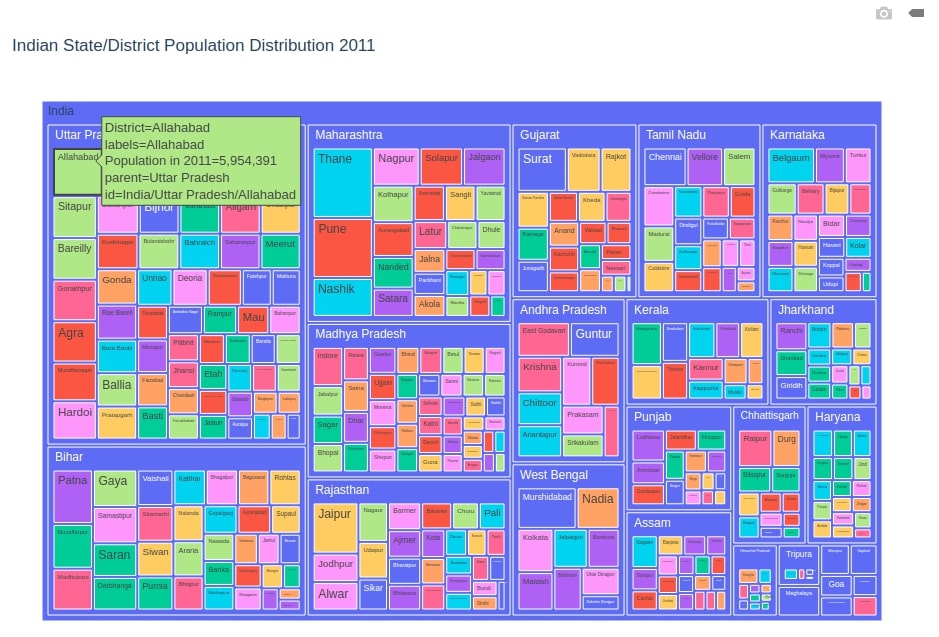
Indian State/District Population Distribution 2011 Treemap
Our second treemap consists of the population distribution of India per state per district for the year 2011.
fig = px.treemap(district_wise_population,
                 path=['Country', 'State', 'District'],
                 values='Population in 2011',
                 color="District",
                 width=1000, height=700,
                 title="Indian State/District Population Distribution 2011",
                 )

fig.show()
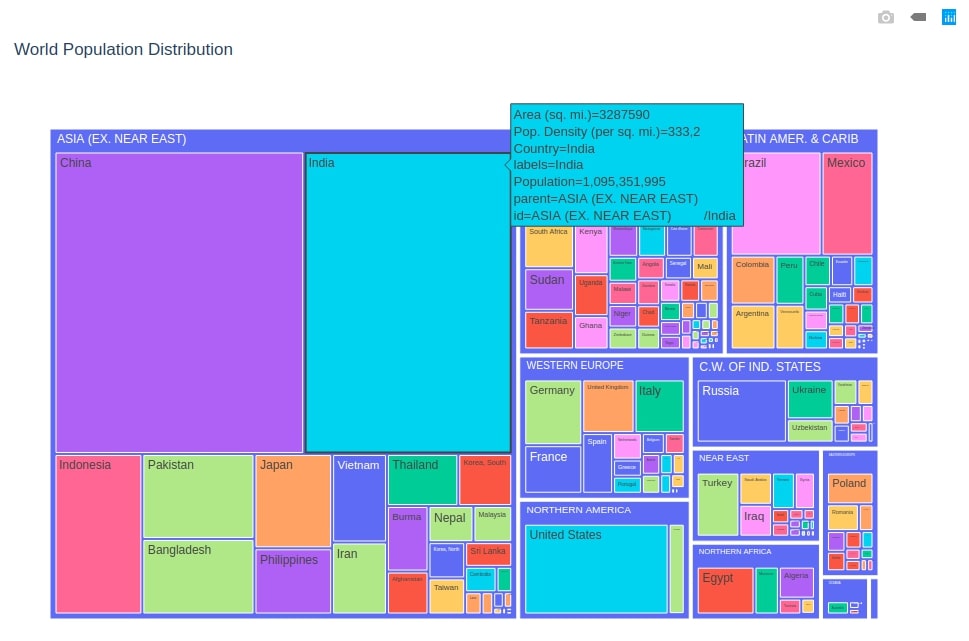
World Population Distribution Treemap
Our third treemap consists of population distribution per country per continent/region.
fig = px.treemap(world_data,
                 path=['Region', 'Country'],
                 values='Population',
                 color='Country',
                 hover_data=['Area (sq. mi.)','Pop. Density (per sq. mi.)'],
                 width=1000, height=700,
                 title="World Population Distribution",)


fig.show()
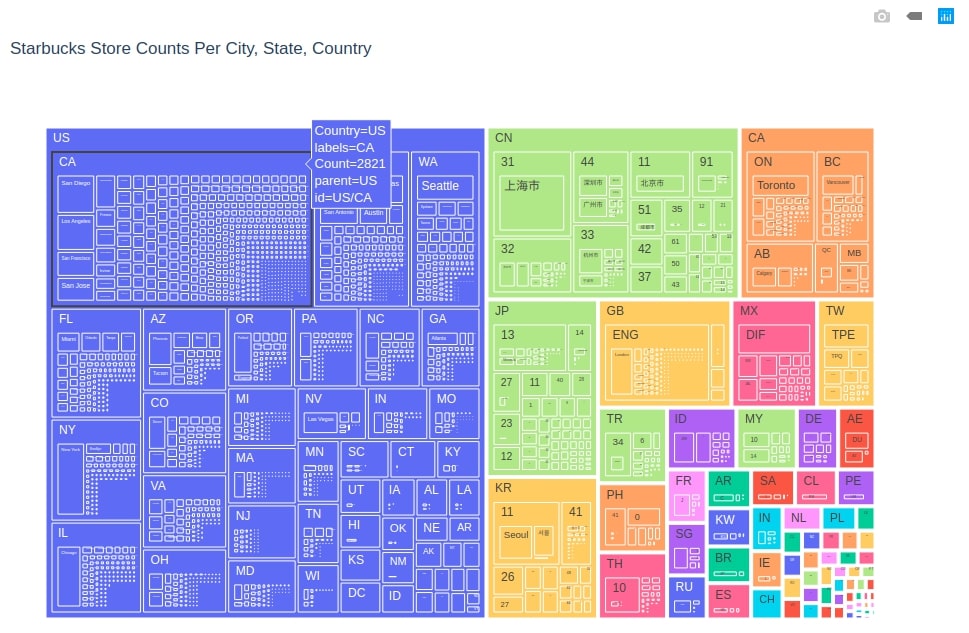
Starbucks Store Counts Per City, State, Country Treemap
Our fourth treemap consists of Starbucks store counts per city per state per country for the whole world.We have color-encoded it by country.
fig = px.treemap(starbucks_stores,
                 path=["Country","State/Province","City"],
                 values='Count',
                 color='Country',
                 width=1000, height=700,
                 title="Starbucks Store Counts Per City, State, Country",)

fig.show()
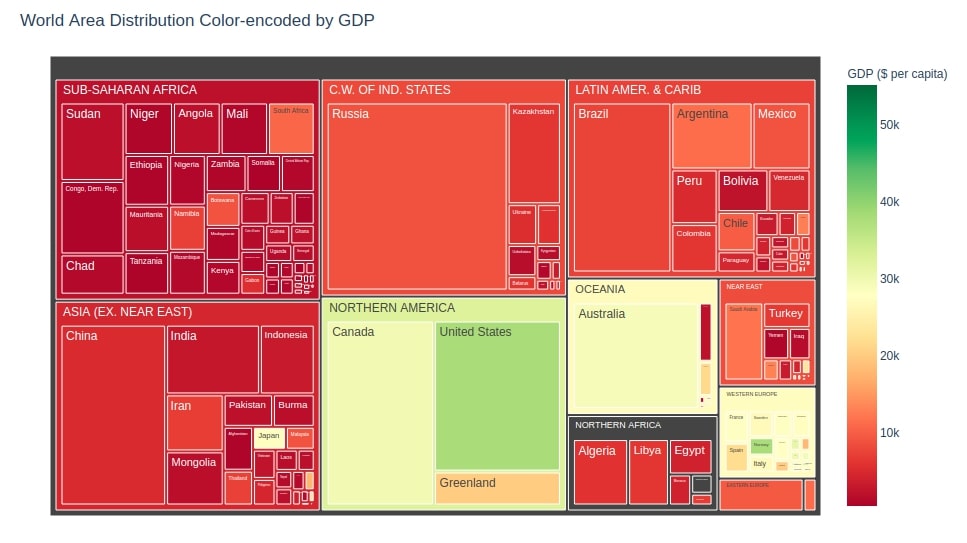
World Area Distribution Color-encoded by GDP Treemap
Our fifth treemap consists of Area distribution per region per country for the whole world. We have also color-encoded it by GDP for each country so that we can see how area and GDP are related.
We can notice from the below graph that countries like Russia, China, Canada, the US, Brazil, Australia have high areas but GDP per capita is high for Canada, US, Australia.
fig = px.treemap(world_data,
                 path=['Region', 'Country'],
                 values='Area (sq. mi.)',
                 color='GDP ($ per capita)',
                 color_continuous_scale='RdYlGn',
                  )

fig.update_layout(title="World Area Distribution Color-encoded by GDP",
                  width=1000, height=600,)

fig.show()
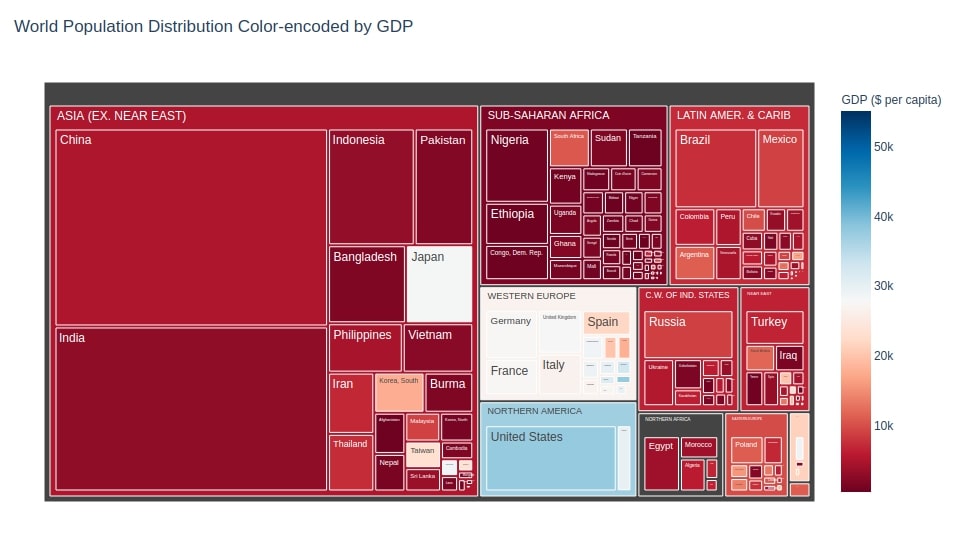
World Population Distribution Color-encoded by GDP Treemap
Our sixth treemap consists of Population distribution per region per country for the whole world. We have also color-encoded it by GDP for each country so that we can see how Population and GDP are related.
We can notice from below graph that countries like China, India, US, Brazil, Pakistan, Indonesia has high area but GDP per capita is high for the US, Australia, and most Europe countries.
fig = px.treemap(world_data,
                 path=['Region', 'Country'],
                 values='Population',
                 color='GDP ($ per capita)',
                 color_continuous_scale='RdBu',
                 width=1000, height=600,
                 title="World Population Distribution Color-encoded by GDP",)

fig.show()
NOTE
Please make a note that it's advisable to use Treemap for representing data till 3 hierarchical layers only. If used beyond 3 layers then it'll become difficult to interpret for viewer.
This ends our small tutorial on generating Treemap in python using plotly. Please feel free to let us know your views in the comment section.
References
 Sunny Solanki
Sunny Solanki
Intro: Software Developer | Youtuber | Bonsai Enthusiast
About: Sunny Solanki holds a bachelor's degree in Information Technology (2006-2010) from L.D. College of Engineering. Post completion of his graduation, he has 8.5+ years of experience (2011-2019) in the IT Industry (TCS). His IT experience involves working on Python & Java Projects with US/Canada banking clients. Since 2020, he’s primarily concentrating on growing CoderzColumn.
His main areas of interest are AI, Machine Learning, Data Visualization, and Concurrent Programming. He has good hands-on with Python and its ecosystem libraries.
Apart from his tech life, he prefers reading biographies and autobiographies. And yes, he spends his leisure time taking care of his plants and a few pre-Bonsai trees.
Contact: sunny.2309@yahoo.in


![YouTube Subscribe]() Comfortable Learning through Video Tutorials?
Comfortable Learning through Video Tutorials?
If you are more comfortable learning through video tutorials then we would recommend that you subscribe to our YouTube channel.
![Need Help]() Stuck Somewhere? Need Help with Coding? Have Doubts About the Topic/Code?
Stuck Somewhere? Need Help with Coding? Have Doubts About the Topic/Code?
 Stuck Somewhere? Need Help with Coding? Have Doubts About the Topic/Code?
When going through coding examples, it's quite common to have doubts and errors.
If you have doubts about some code examples or are stuck somewhere when trying our code, send us an email at coderzcolumn07@gmail.com. We'll help you or point you in the direction where you can find a solution to your problem.
You can even send us a mail if you are trying something new and need guidance regarding coding. We'll try to respond as soon as possible.
![Share Views]() Want to Share Your Views? Have Any Suggestions?
Want to Share Your Views? Have Any Suggestions?
 Want to Share Your Views? Have Any Suggestions?
If you want to
- provide some suggestions on topic
- share your views
- include some details in tutorial
- suggest some new topics on which we should create tutorials/blogs
 treemap, plotly