Interactive Maps using Folium
Table of Contents
- Introduction
- 1. Loading Maps
- 2. Maps with Marker, Points, Polygon, Line, etc.
- 2.1. Indian State Population Bubble Chart
- 2.2 Indian States Census Scatter Map
- 2.3 US Statewise Starbucks Store Counts Scatter Map
- 2.4 Indian State (Gujarat) Districts Census Scatter Map
- 2.5 Indian State (Gujarat) Districts Census Scatter Map
- 2.6 Indian State (Gujarat) Districts Census with Markers
- 2.7 New York City Starbucks Locations Map with Markers
- 2.8 Indian State (Gujarat) Districts Census with Markers & Lines Connecting Districts
- 2.9 Indian State (Gujarat) Districts Census with Markers & Polygons
- 3. Choropleth Maps
- 4. Saving Maps as HTML
- References
Introduction 
folium is a python map plotting library based on leaflet.js. After manipulating data in python, we can visualize it on an interactive map using folium. folium has a number of rich tilesets from OpenStreetMap, Mapbox, and Stamen, and supports custom tilesets with Mapbox or Cloudmade API keys.
Dependencies
folium is mainly dependent on below-mentioned libraries:
- branca, jinja2, and requests.
Installation
- pip install folium
- conda install folium -c conda-forge
We'll explain basic usage of folium like plotting scatter map and choropleth map using geospatial datasets from kaggle. We'll also explain various tilesets with examples as well as few basic functionalities.
Let’s start loading required libraries.
import pandas as pd
import numpy as np
import folium
Loading Datasets
We'll be loading 4 datasets that have longitude and latitude data for various locations on earth. Please download all datasets from kaggle.com to follow along.
district_wise_census = pd.read_csv("datasets/indian-census-data-with-geospatial-indexing/district wise population and centroids.csv")
district_wise_census.head()
state_wise_centroid = pd.read_csv("datasets/indian-census-data-with-geospatial-indexing/state wise centroids_2011.csv")
state_wise_census = district_wise_census.groupby(by="State").sum()[["Population in 2001","Population in 2011"]].reset_index()
state_wise_census = state_wise_centroid.merge(state_wise_census, left_on="State", right_on="State")
state_wise_census.head()
starbucks_locations = pd.read_csv("datasets/starbucks_store_locations.csv")
starbucks_locations = starbucks_locations.dropna().reset_index()
starbucks_locations.head()
happiness_report = pd.read_csv("datasets/world_happiness_2019.csv")
happiness_report.head()
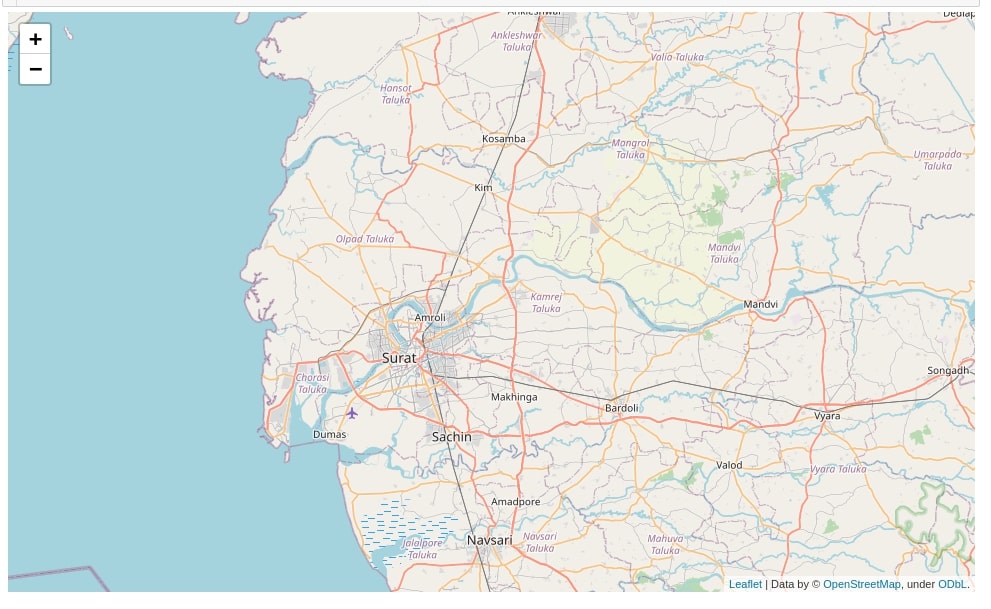
1. Loading Maps 
We'll start by showing a few examples of how to load maps with just single latitude and longitude. Below we are loading Surat city from the Gujarat State of India from where coderzcolumn developers belong.
surat_city_long = district_wise_census[district_wise_census["District"] == "Surat"].Longitude.values[0]
surat_city_lat = district_wise_census[district_wise_census["District"] == "Surat"].Latitude.values[0]

m = folium.Map(location=[surat_city_lat, surat_city_long])
m
Folium provides a list of tiles as mentioned below. We'll need APIs for using Cloudmade and Mapbox tiles.
- "OpenStreetMap" (Default)
- "Mapbox Bright" (Limited levels of zoom for free tiles)
- "Mapbox Control Room" (Limited levels of zoom for free tiles)
- "Stamen" (Terrain, Toner, and Watercolor)
- "Cloudmade" (Must pass API key)
- "Mapbox" (Must pass API key)
- "CartoDB" (positron and dark_matter)
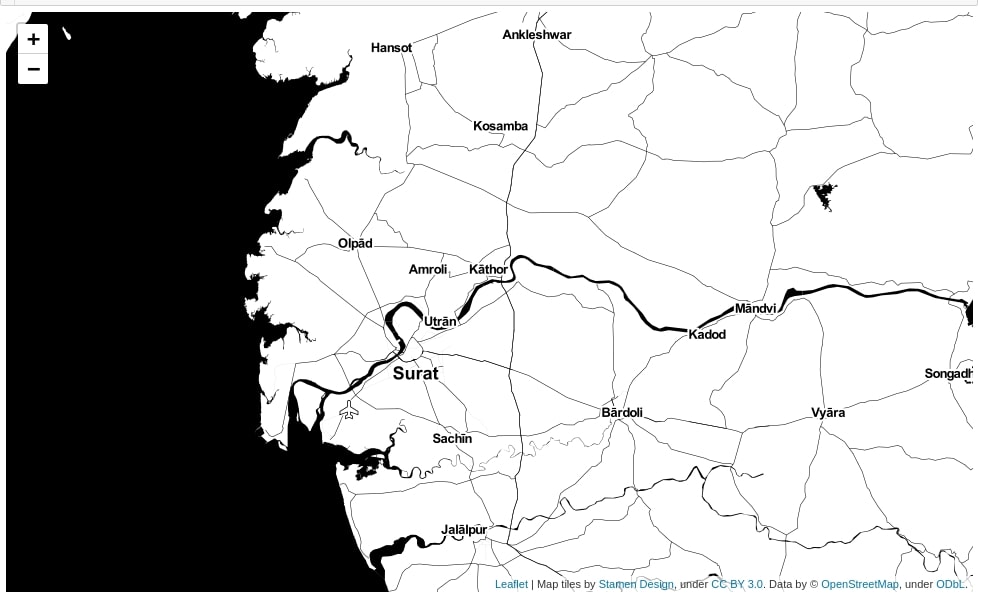
Below we are loading again same city map with tile Stamen Toner.
m = folium.Map(location=[surat_city_lat, surat_city_long], tiles="Stamen Toner",zoom_start=10)
m
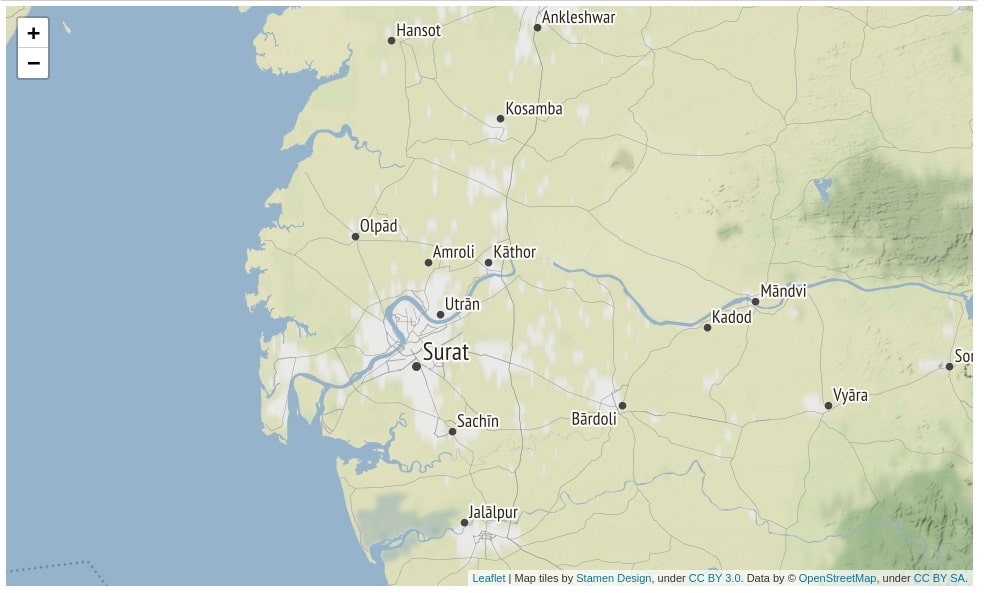
Another map with Stamen Terrain tile. We have also added LatLongPopup to map so that it brings in a popup at a location in a graph where you click displaying Latitude and Longitude of that location.
m = folium.Map(location=[surat_city_lat, surat_city_long], tiles="Stamen Terrain",zoom_start=10)

folium.LatLngPopup().add_to(m)

m
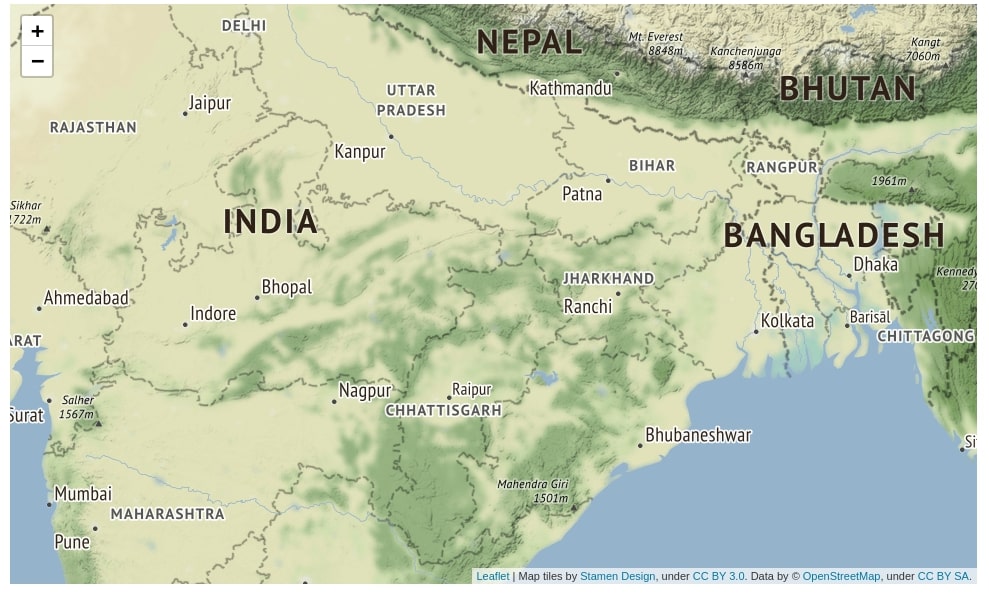
Below we have loaded another map by taking center latitude and longitude for India and then have set bounds to cover in a map using FitBounds.
center_lat = state_wise_census.mean().Latitude
center_long = state_wise_census.mean().Longitude

m = folium.Map(location=[center_lat, center_long], tiles="Stamen Terrain")

folium.FitBounds([(center_lat-5,center_long-5), (center_lat+5,center_long+5)]).add_to(m)

m
2. Maps with Marker, Points, Polygon, Line, etc. 
We'll start adding data to above-described maps with points, markers, polygon, lines plotted on it. We'll explain a few examples describing various features of folium.
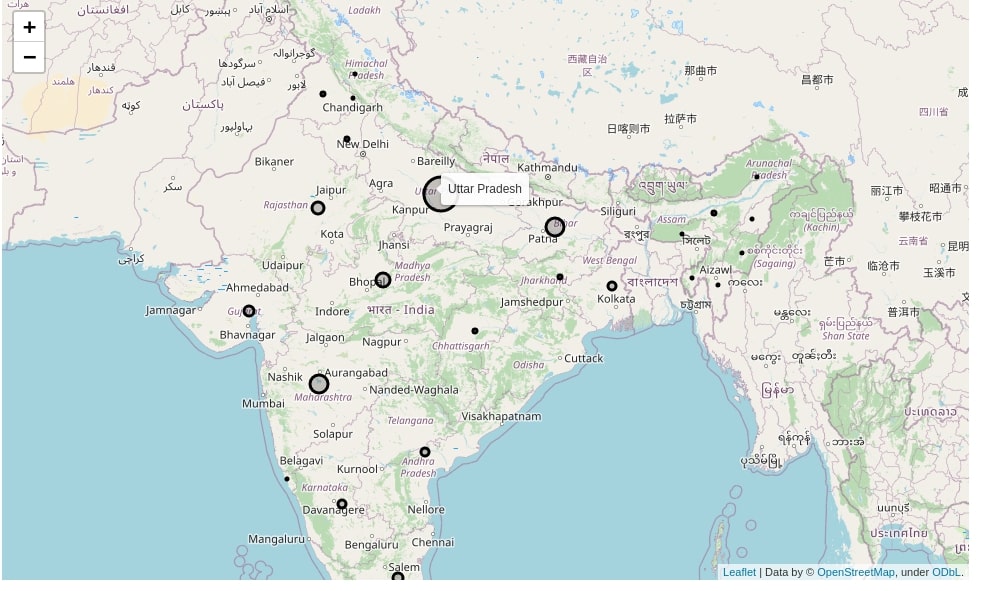
2.1. Indian State Population Bubble Chart 
We are plotting a state-wise census bubble chart for India using CircleMarker. We also have used tooltip and popup for displaying a count of the population for states. We also have taken population count to calculate the radius of the bubble by dividing it by 1e7 so that it stays within bounds and does not flood on map.
center_lat = state_wise_census.mean().Latitude
center_long = state_wise_census.mean().Longitude

m = folium.Map(location=[center_lat, center_long], zoom_start=4.5)

for state in state_wise_census["State"].unique():
    state_census = state_wise_census[state_wise_census["State"]==state]
    folium.CircleMarker(
        location=[state_census.Latitude.values[0], state_census.Longitude.values[0]],
        radius = float(state_census["Population in 2011"].values[0]/1e7),
        popup="Population 2011 : %s"%state_census["Population in 2011"].values[0],
        tooltip = state_census.State.values[0],
        color="black",
        fill_color="black"
    ).add_to(m)

m
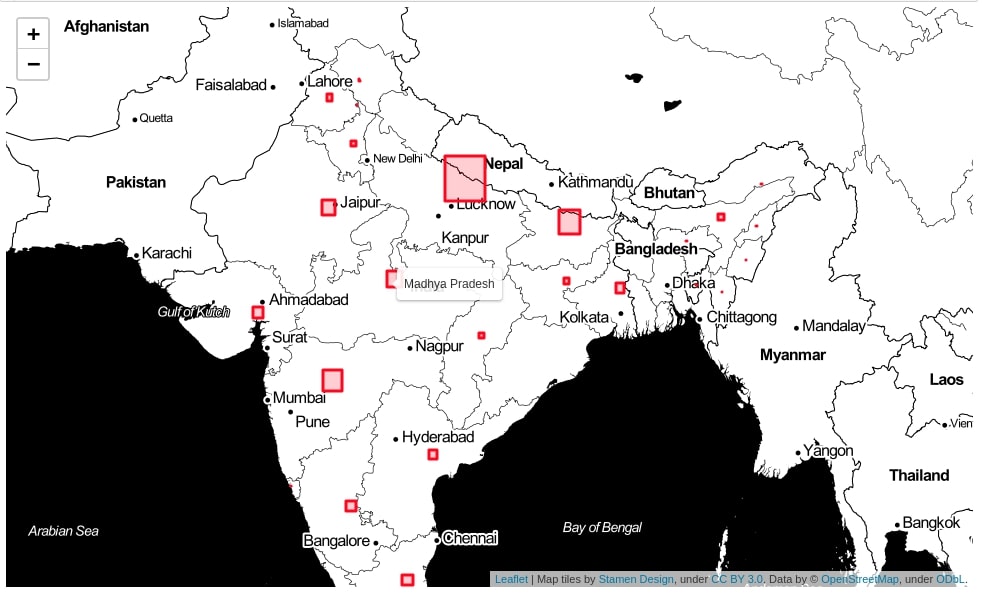
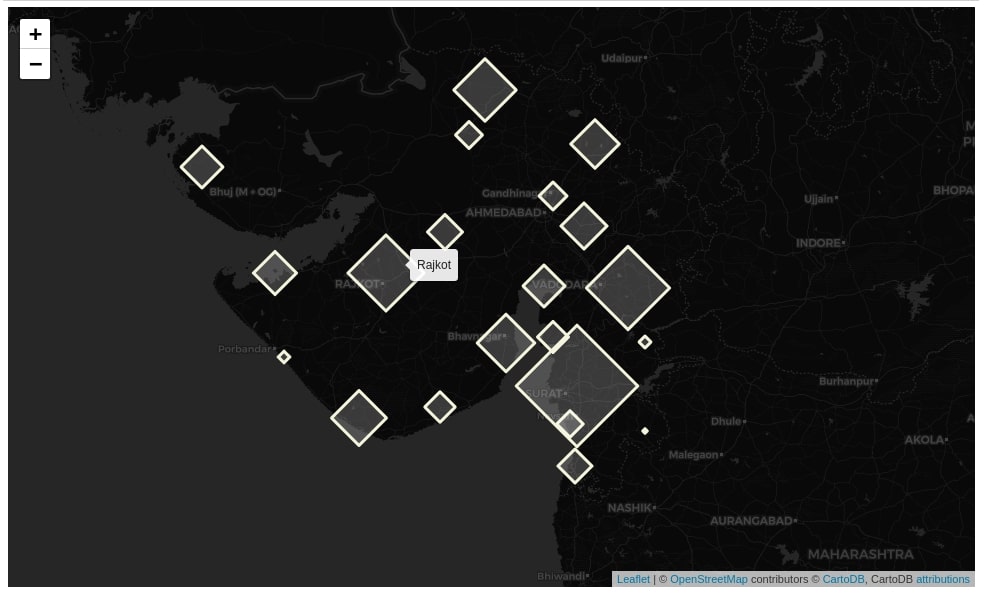
2.2 Indian States Census Scatter Map 
We have again plotted a map with a statewide census of India. We have used rectangle this time instead of circles.
center_lat = state_wise_census.mean().Latitude
center_long = state_wise_census.mean().Longitude

m = folium.Map(location=[center_lat, center_long], zoom_start=4.5, tiles="Stamen Toner")

for state in state_wise_census["State"].unique():
    state_census = state_wise_census[state_wise_census["State"]==state]
    lat, lon = state_census.Latitude.values[0], state_census.Longitude.values[0]
    population = state_census["Population in 2011"].values[0]
    folium.Rectangle(
        bounds=[(lat, lon), (lat+(population/1e8), lon+(population/1e8))],
        popup="Population 2011 : %s"%population,
        tooltip = state_census.State.values[0],
        color="red",
        fill_color="red"
    ).add_to(m)

m
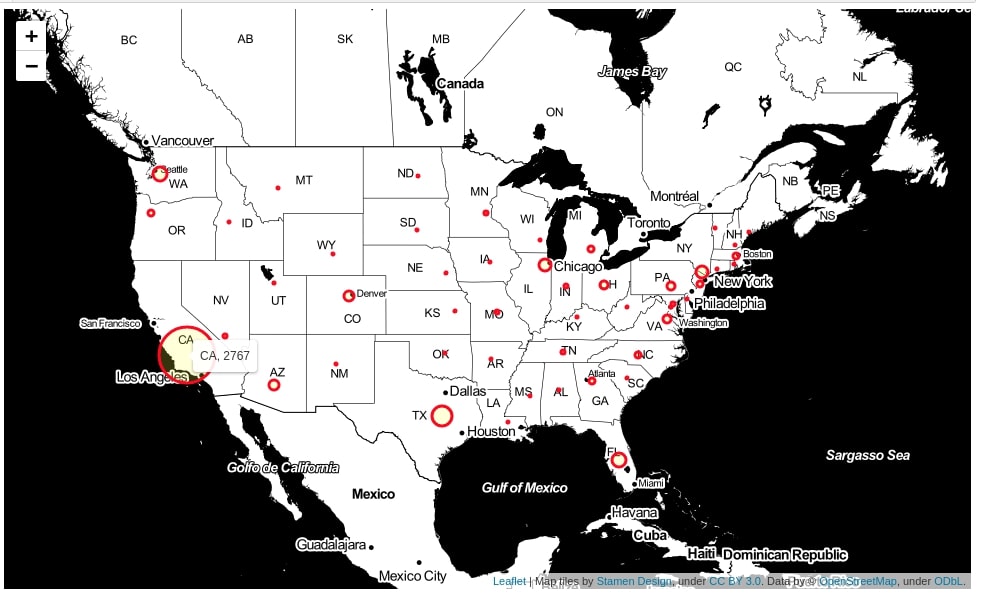
2.3 US Statewise Starbucks Store Counts Scatter Map 
We have first calculated the US states Starbucks store counts. We have then taken an average of latitude and longitude for the location of stores in each state. We are then plotting a scatter plot on it using CircleMarker where circle size represents a number of stores.
starbucks_us = starbucks_locations[starbucks_locations["Country"] == "US"].reset_index()
starbucks_us_state_count = starbucks_us.groupby(by="State/Province").count()[["index"]].rename(columns={"index":"Count"}).reset_index()
starbucks_us_lat_lon = starbucks_us.groupby(by="State/Province").mean()[["Latitude", "Longitude"]].reset_index()
starbucks_us = starbucks_us_state_count.merge(starbucks_us_lat_lon, right_on="State/Province", left_on="State/Province").reset_index()

center_lat = starbucks_us.mean().Latitude
center_long = starbucks_us.mean().Longitude

m = folium.Map(location=[center_lat, center_long], zoom_start=4, tiles="Stamen Toner")

for idx in starbucks_us.index:
    row = starbucks_us.iloc[idx]
    lat, long = row.Latitude, row.Longitude
    folium.CircleMarker(
        location=[lat, long],
        radius = float(row.Count/100),
        draggable = False,
        color="red",
        popup = row["State/Province"],
        tooltip = str(row["State/Province"]) + ", " + str(row["Count"]),
        fill_color="yellow"
        ).add_to(m)
m
NOTE
Please make a note that if you are plotting too many points like more than 1k points and try to display it in jupyter notebook then it won't render due to some limitation of chrome/notebook. If you are plotting too many points and jupyter notebook is not displaying output then it's a better idea to save the map as HTML file and open it in chrome to see output.
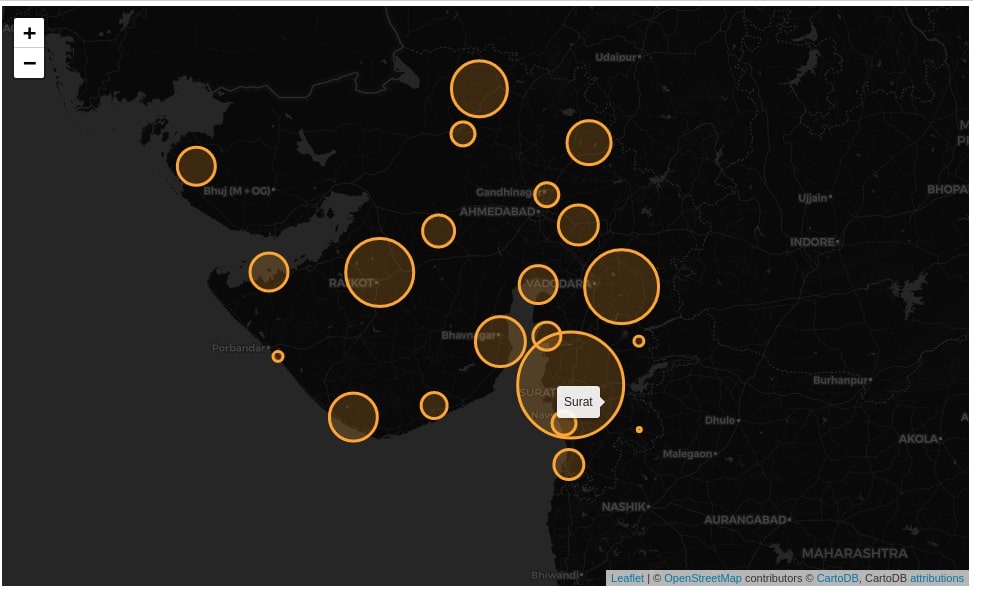
2.4 Indian State (Gujarat) Districts Census Scatter Map 
We have created another scatter map that represents district wise census for the Gujarat state of India. We have used tile CartoDB dark_matter for this chart. Each bubble in the map represents the population of that districts. We have also used tooltip and popup for displaying census of the district.
gujarat_districts = district_wise_census[district_wise_census["State"]=="Gujarat"]

center_lat = gujarat_districts.mean().Latitude
center_long = gujarat_districts.mean().Longitude

m = folium.Map(location=[center_lat, center_long], zoom_start=6.5, tiles="CartoDB dark_matter")

for district in gujarat_districts["District"].unique():
    district_census = gujarat_districts[gujarat_districts["District"]==district]
    folium.Circle(
        location=[district_census.Latitude.values[0], district_census.Longitude.values[0]],
        radius = float(district_census["Population in 2011"].values[0]/100),
        color="orange",
        fill_color="orange",
        popup="Population 2011 : %s"%district_census["Population in 2011"].values[0],
        tooltip = district_census.District.values[0],
    ).add_to(m)

m
2.5 Indian State (Gujarat) Districts Census Scatter Map 
The below the map is almost the same as above map with bubbles replaced by RegularPolygonMarker.
gujarat_districts = district_wise_census[district_wise_census["State"]=="Gujarat"]

center_lat = gujarat_districts.mean().Latitude
center_long = gujarat_districts.mean().Longitude

m = folium.Map(location=[center_lat, center_long], zoom_start=6.5, tiles="CartoDB dark_matter")

for district in gujarat_districts["District"].unique():
    district_census = gujarat_districts[gujarat_districts["District"]==district]
    folium.RegularPolygonMarker(
        location=[district_census.Latitude.values[0], district_census.Longitude.values[0]],
        radius = float(district_census["Population in 2011"].values[0]/100000),
        rotation=0,
        color="beige",
        popup="Population 2011 : %s"%district_census["Population in 2011"].values[0],
        tooltip = district_census.District.values[0],
        fill_color="white"
    ).add_to(m)

m
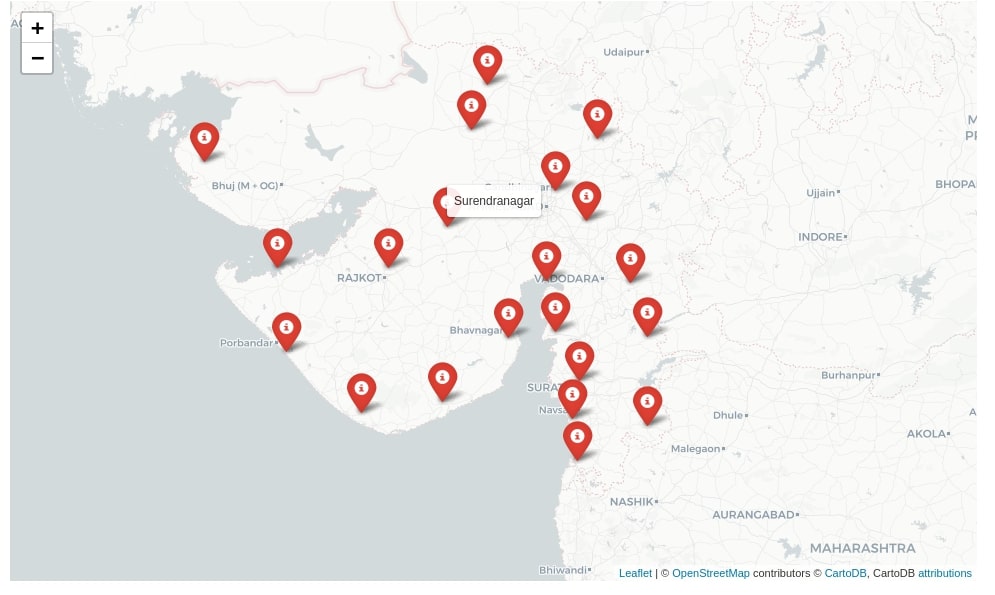
2.6 Indian State (Gujarat) Districts Census with Markers 
We have plotted a map with markers on various districts of Gujarat state of India. We have also used popup and tooltip to display census for district in 2011.
gujarat_districts = district_wise_census[district_wise_census["State"]=="Gujarat"]

center_lat = gujarat_districts.mean().Latitude
center_long = gujarat_districts.mean().Longitude

m = folium.Map(location=[center_lat, center_long], zoom_start=6.5, tiles="CartoDB positron")

for district in gujarat_districts["District"].unique():
    district_census = gujarat_districts[gujarat_districts["District"]==district]
    folium.Marker(
        location=[district_census.Latitude.values[0], district_census.Longitude.values[0]],
        popup="Population 2011 : %s"%district_census["Population in 2011"].values[0],
        tooltip = district_census.District.values[0],
        icon=folium.Icon(icon='info-sign', color="red"),
        draggable=False
    ).add_to(m)

m
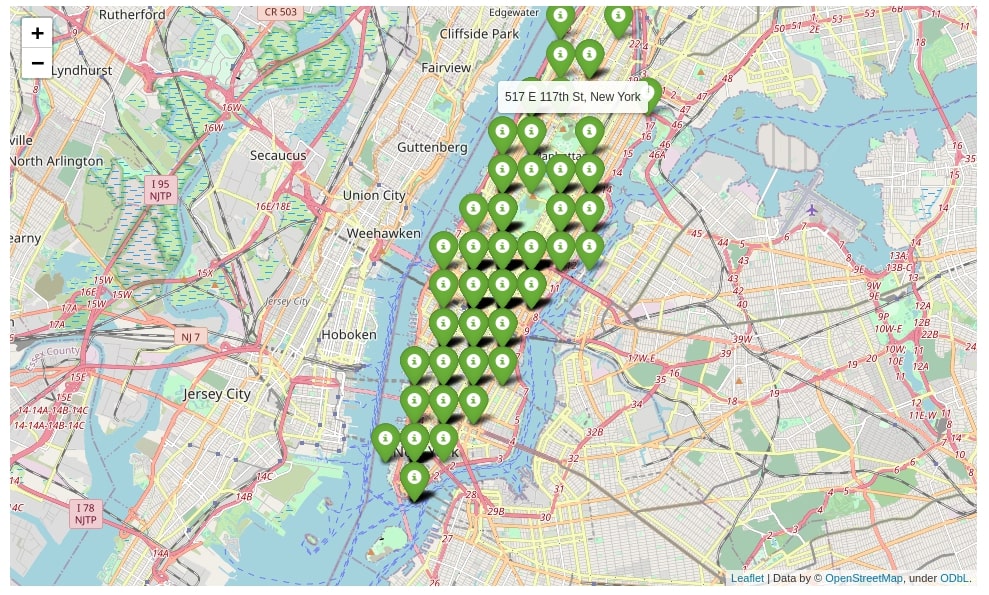
2.7 New York City Starbucks Locations Map with Markers 
Below we are using markers on the new york city map where each marker represents the Starbucks store. We have also used popup and tooltip which displays store address.
starbucks_ny = starbucks_locations[starbucks_locations["City"] == "New York"].reset_index()

center_lat = starbucks_ny.mean().Latitude
center_long = starbucks_ny.mean().Longitude

m = folium.Map(location=[center_lat, center_long], zoom_start=11.5, )#tiles="Stamen Toner")

for idx in starbucks_ny.index:
    row = starbucks_ny.iloc[idx]
    lat, long = row.Latitude, row.Longitude
    folium.Marker(
        location=[lat, long],
        draggable=False,
        popup= row["Store Name"],
        tooltip = str(row["Street Address"]) + ", " + str(row["City"]),
        icon=folium.Icon(icon='info-sign', color="green")
        ).add_to(m)


m
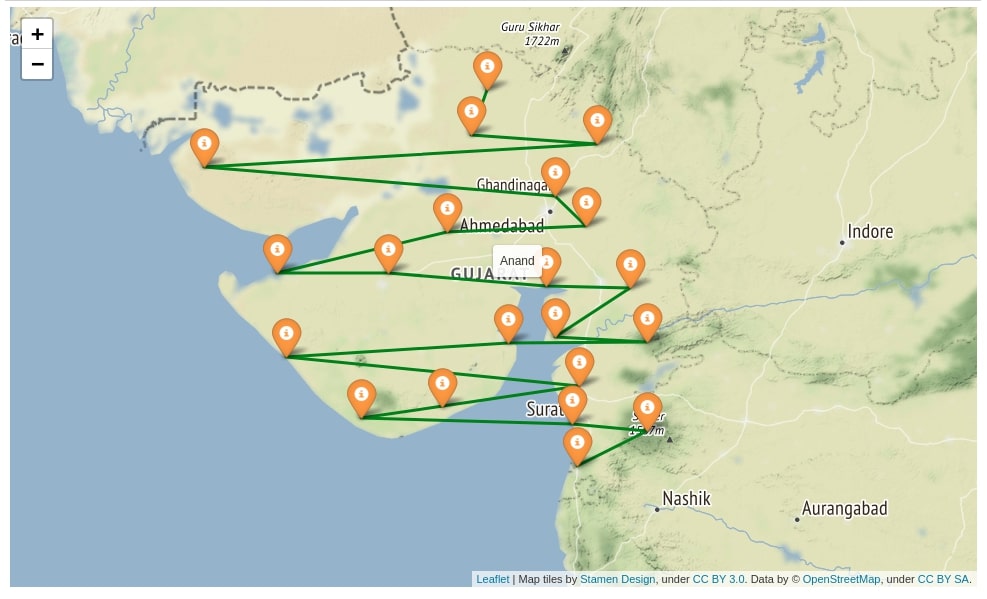
2.8 Indian State (Gujarat) Districts Census with Markers & Lines Connecting Districts 
Below we are plotting markers on the state of Gujarat (India) where each marker represents districts of the state. We have then tried to link all districts by using PolyLine. PolyLine lets us display lines on the map.
gujarat_districts = district_wise_census[district_wise_census["State"]=="Gujarat"]

center_lat = gujarat_districts.mean().Latitude
center_long = gujarat_districts.mean().Longitude

m = folium.Map(location=[center_lat, center_long], zoom_start=6.5, tiles="Stamen Terrain")

for district in gujarat_districts["District"].unique():
    district_census = gujarat_districts[gujarat_districts["District"]==district]
    folium.Marker(
        location=[district_census.Latitude.values[0], district_census.Longitude.values[0]],
        popup="Population 2011 : %s"%district_census["Population in 2011"].values[0],
        tooltip = district_census.District.values[0],
        icon=folium.Icon(icon='info-sign', color="orange")
    ).add_to(m)

folium.PolyLine(
    locations=sorted(zip(gujarat_districts.Latitude, gujarat_districts.Longitude)),
    popup="Path",
    tooltip = "Path",
    color="green",
).add_to(m)

m
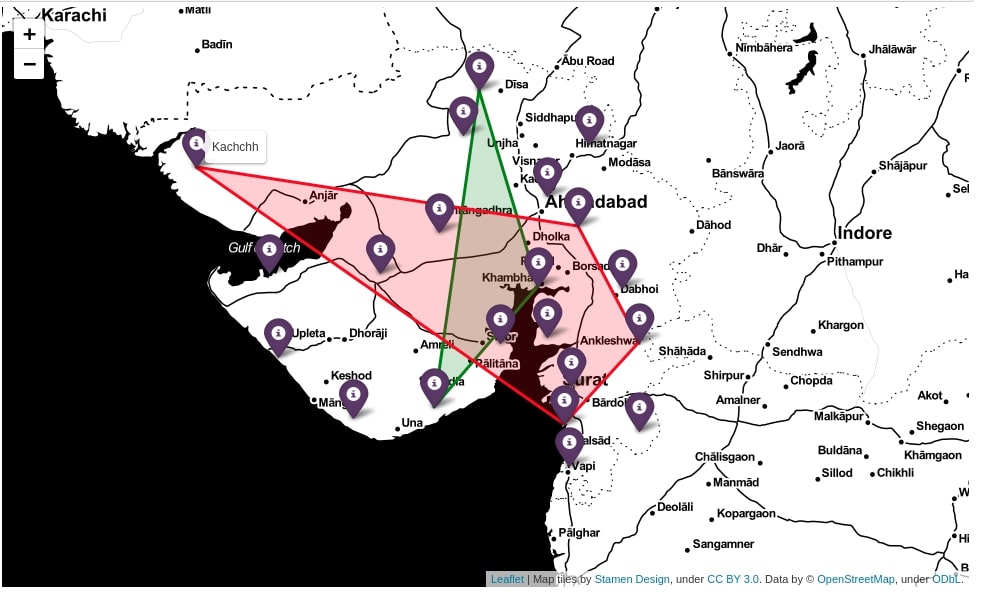
2.9 Indian State (Gujarat) Districts Census with Markers & Polygons 
Below we are plotting markers on the state of Gujarat (India) where each marker represents districts of the state. We are then plotting polygons to identify a particular area by calling Polygon method of folium passing it list of locations. We are plotting 2 random polygons to display use of it.
gujarat_districts = district_wise_census[district_wise_census["State"]=="Gujarat"]

center_lat = gujarat_districts.mean().Latitude
center_long = gujarat_districts.mean().Longitude

m = folium.Map(location=[center_lat, center_long], zoom_start=6.5, tiles="Stamen Toner")

for district in gujarat_districts["District"].unique():
    district_census = gujarat_districts[gujarat_districts["District"]==district]
    folium.Marker(
        location=[district_census.Latitude.values[0], district_census.Longitude.values[0]],
        popup="Population 2011 : %s"%district_census["Population in 2011"].values[0],
        tooltip = district_census.District.values[0],
        icon=folium.Icon(icon='info-sign', color="darkpurple")
    ).add_to(m)

folium.Polygon(
    locations=list(zip(gujarat_districts.Latitude, gujarat_districts.Longitude))[:3],
    popup="Path",
    tooltip = "Path",
    color="green",
    fill_color="green"
).add_to(m)

folium.Polygon(
    locations=list(zip(gujarat_districts.Latitude, gujarat_districts.Longitude))[8:12],
    popup="Path",
    tooltip = "Path",
    color="red",
    fill_color="red"
).add_to(m)

m
3. Choropleth Maps 
We'll now explain how to plot choropleth maps using folium.
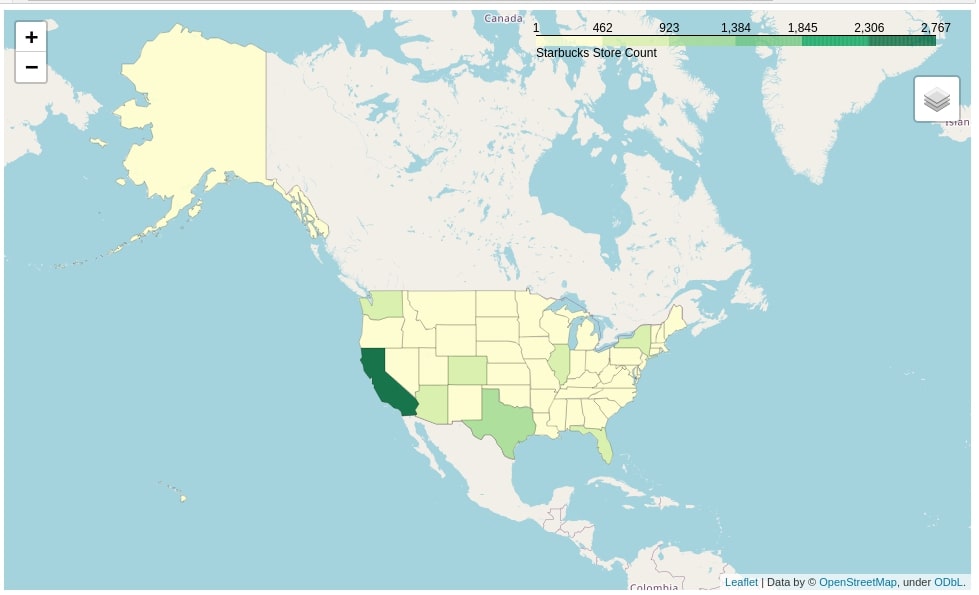
3.1 US States Starbucks Stores Counts Choropleth 
We need polygon (list of latitudes and longitudes) representing the region to plot choropleth maps with folium. Below we are downloading USA states geo JSON which has polygon for each states of US. We are then linking it to columns of Starbucks locations dataframe. The linking between polygon JSON and pandas dataframe happens based on one key column the same between them. We then pass another column to columns attribute of Choropleth() for which we need to create choropleth maps.
url = 'https://raw.githubusercontent.com/python-visualization/folium/master/examples/data'
state_geo = f'{url}/us-states.json'

starbucks_us_state_count = starbucks_locations.groupby(by="State/Province").count()[["index"]].rename(columns={"index":"Count"}).reset_index()

m = folium.Map(location=[48, -102], zoom_start=3)

folium.Choropleth(
    geo_data=state_geo,
    name='choropleth',
    data=starbucks_us_state_count,
    columns=['State/Province', 'Count'],
    key_on='feature.id',
    fill_color='YlGn',
    fill_opacity=0.9,
    line_opacity=0.2,
    legend_name='Starbucks Store Count'
).add_to(m)

folium.LayerControl().add_to(m)

m
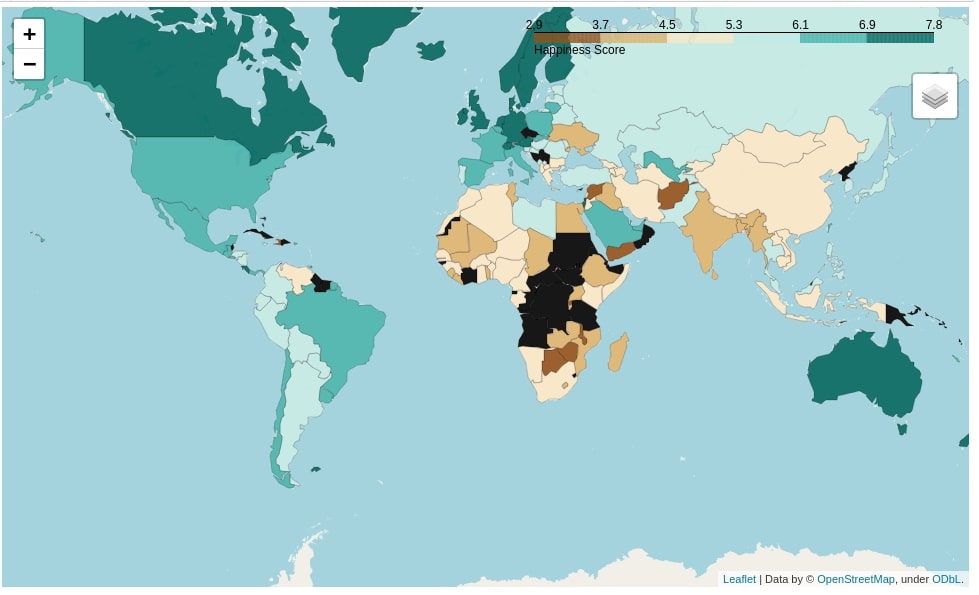
3.2 World Happiness Score Choropleth 
For this map, we need to download geo JSON for a world with polygon representing each country of the earth. We suggest that you download it from here. We noticed that feature key of JSON has a key named properties which has a dictionary with a key named sovereignt that maintains country name. The country named mentioned in JSON at feature.properties.sovereignt matches with a country named mentioned in Country or region column of happiness report dataframe.
m = folium.Map(location=[0,0], zoom_start=1.5)

folium.Choropleth(
    geo_data="datasets/custom.geo.json",
    name='choropleth',
    data=happiness_report,
    columns=['Country or region', 'Score'],
    key_on='feature.properties.sovereignt',
    fill_color='BrBG',
    fill_opacity=0.9,
    line_opacity=0.2,
    legend_name='Happiness Score'
).add_to(m)

folium.LayerControl().add_to(m)

m
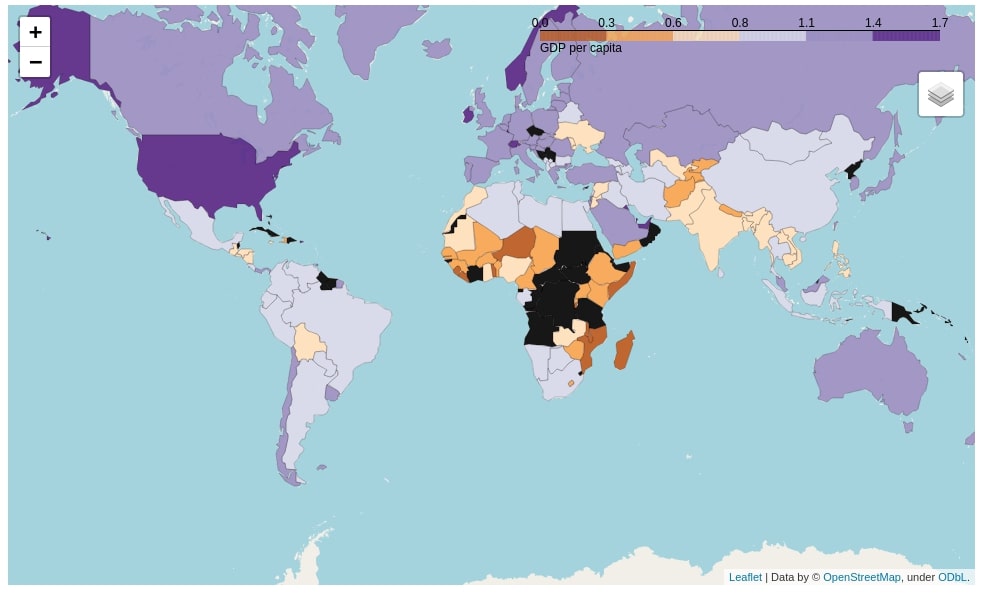
3.3 World GDP Per Capita Choropleth Map 
Below is another choropleth map linking GDP per capita column of happiness report dataframe with a world map.
m = folium.Map(location=[0,0], zoom_start=1.5)

folium.Choropleth(
    geo_data="datasets/custom.geo.json",
    name='choropleth',
    data=happiness_report,
    columns=['Country or region', 'GDP per capita'],
    key_on='feature.properties.sovereignt',
    fill_color='PuOr',
    fill_opacity=0.9,
    line_opacity=0.2,
    legend_name='GDP per capita'
).add_to(m)

folium.LayerControl().add_to(m)

m
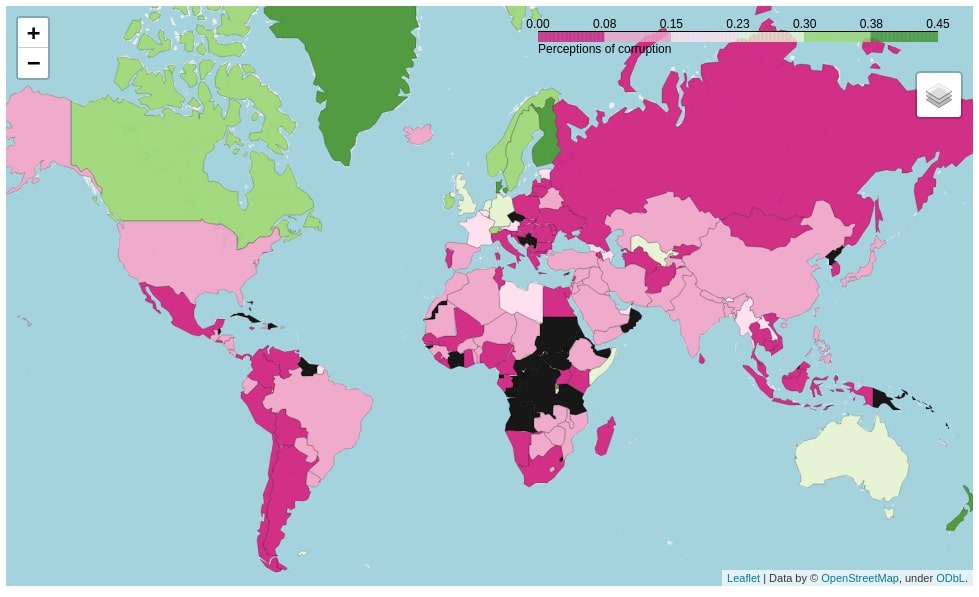
3.4 World Perception of Corruption Choropleth Map 
Below is another choropleth map linking Perceptions of corruption column of happiness report dataframe with a world map.
m = folium.Map(location=[0,0], zoom_start=1.5)

folium.Choropleth(
    geo_data="datasets/custom.geo.json",
    name='choropleth',
    data=happiness_report,
    columns=['Country or region', 'Perceptions of corruption'],
    key_on='feature.properties.sovereignt',
    fill_color='PiYG',
    fill_opacity=0.9,
    line_opacity=0.2,
    legend_name='Perceptions of corruption'
).add_to(m)

folium.LayerControl().add_to(m)

m
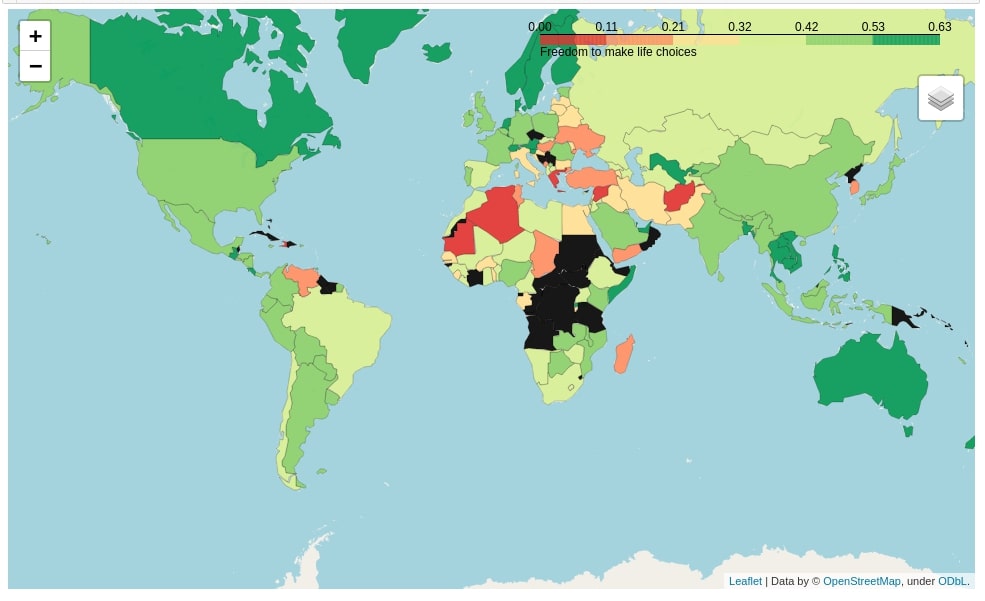
3.5 World Freedom to Make Life Choices Choropleth Map 
Below is another choropleth map linking Freedom to make life choices column of happiness report dataframe with a world map.
m = folium.Map(location=[0,0], zoom_start=1.5)

folium.Choropleth(
    geo_data="datasets/custom.geo.json",
    name='choropleth',
    data=happiness_report,
    columns=['Country or region', 'Freedom to make life choices'],
    key_on='feature.properties.sovereignt',
    fill_color='RdYlGn',
    fill_opacity=0.9,
    line_opacity=0.2,
    legend_name='Freedom to make life choices'
).add_to(m)

folium.LayerControl().add_to(m)

m
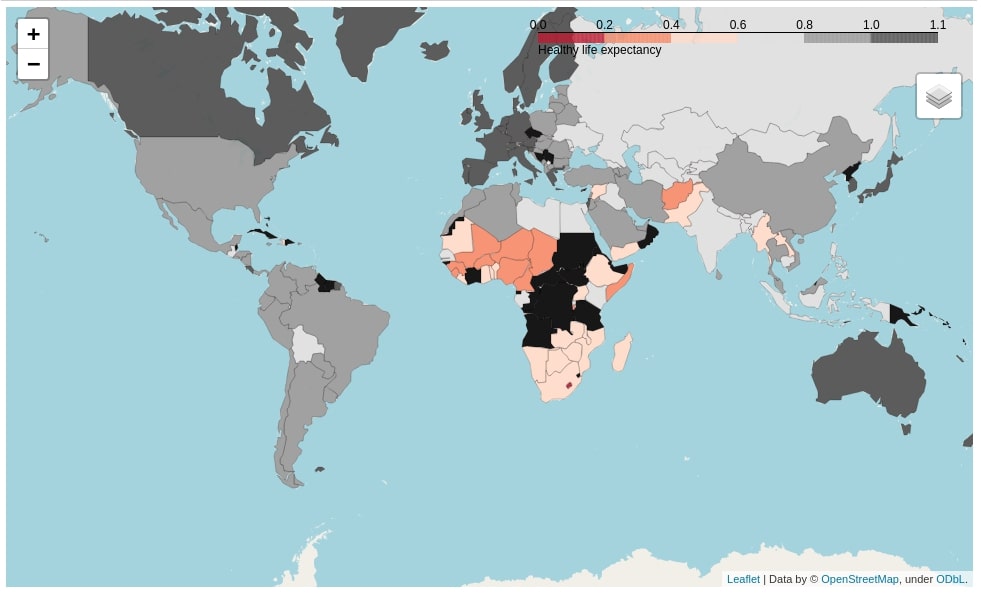
3.6 World Healthy Life Expectancy Choropleth Map 
Below is another choropleth map linking Healthy life expectancy column of happiness report dataframe with a world map.
m = folium.Map(location=[0,0], zoom_start=1.5)

folium.Choropleth(
    geo_data="datasets/custom.geo.json",
    name='choropleth',
    data=happiness_report,
    columns=['Country or region', 'Healthy life expectancy'],
    key_on='feature.properties.sovereignt',
    fill_color='RdGy',
    fill_opacity=0.9,
    line_opacity=0.2,
    legend_name='Healthy life expectancy'
).add_to(m)

folium.LayerControl().add_to(m)

m
We can change various colormaps for choropleth maps. Please look at this link to try various colormaps.
4. Saving Maps as HTML 
We can save folium plots as HTML files by calling save() method on map objects.
m.save("Healthy life expectancy.html")
This ends our small tutorial on folium library usage. Please feel free to let us know your views in the comments.
References 
- ipyleaflet - Interactive Maps in Python based on leaflet.js
- Choropleth Maps using ipyleaflet
- Geopandas - Static Maps
- Hvplot - Interactive Maps
- Cartopy - Basic Maps [Scatter Map, Bubble Map & Connection Map]
- Maps using Bqplot
- How to Create Connection Maps in Python [plotly & geopandas]
- Plotting Maps using Bokeh
- Interactive Choropleth Maps using bqplot
- Choropleth Maps and Scatter Maps using cufflinks
- How to convert static geopandas maps to interactive maps using hvplot?
 Sunny Solanki
Sunny Solanki
Intro: Software Developer | Youtuber | Bonsai Enthusiast
About: Sunny Solanki holds a bachelor's degree in Information Technology (2006-2010) from L.D. College of Engineering. Post completion of his graduation, he has 8.5+ years of experience (2011-2019) in the IT Industry (TCS). His IT experience involves working on Python & Java Projects with US/Canada banking clients. Since 2020, he’s primarily concentrating on growing CoderzColumn.
His main areas of interest are AI, Machine Learning, Data Visualization, and Concurrent Programming. He has good hands-on with Python and its ecosystem libraries.
Apart from his tech life, he prefers reading biographies and autobiographies. And yes, he spends his leisure time taking care of his plants and a few pre-Bonsai trees.
Contact: sunny.2309@yahoo.in


![YouTube Subscribe]() Comfortable Learning through Video Tutorials?
Comfortable Learning through Video Tutorials?
If you are more comfortable learning through video tutorials then we would recommend that you subscribe to our YouTube channel.
![Need Help]() Stuck Somewhere? Need Help with Coding? Have Doubts About the Topic/Code?
Stuck Somewhere? Need Help with Coding? Have Doubts About the Topic/Code?
 Stuck Somewhere? Need Help with Coding? Have Doubts About the Topic/Code?
When going through coding examples, it's quite common to have doubts and errors.
If you have doubts about some code examples or are stuck somewhere when trying our code, send us an email at coderzcolumn07@gmail.com. We'll help you or point you in the direction where you can find a solution to your problem.
You can even send us a mail if you are trying something new and need guidance regarding coding. We'll try to respond as soon as possible.
![Share Views]() Want to Share Your Views? Have Any Suggestions?
Want to Share Your Views? Have Any Suggestions?
 Want to Share Your Views? Have Any Suggestions?
If you want to
- provide some suggestions on topic
- share your views
- include some details in tutorial
- suggest some new topics on which we should create tutorials/blogs
 folium, maps