Choropleth Maps using ipyleaflet
The ipyleaflet is a python library for plotting maps. It's built on top of leaflet.js and ipywidgets. We have already covered a detailed tutorial about the usage of ipyleaflet as a separate tutorial. If you are interested in learning about various maps creation using ipyleaflet then we suggest you go through that tutorial.
As a part of this tutorial, we'll be concentrating on how to create choropleth maps using ipyleaflet. The ipyleaflet provides two different constructors which we can use to create choropleth maps.
- Choropleth()
- GeoJSON()
We'll be explaining how to create choropleth maps using both constructors. Both methods require a little bit of data preparation which we'll explain with different examples. We'll be using various datasets for creating choropleth maps.
We'll start by importing necessary libraries.
import pandas as pd
import numpy as np
import json
1. Choropleth Maps Using Choropleth() Constructor
The first way of creating choropleth maps using ipyleaflet is using the Choropleth() constructor. We'll be explaining the usage of this constructor with various examples.
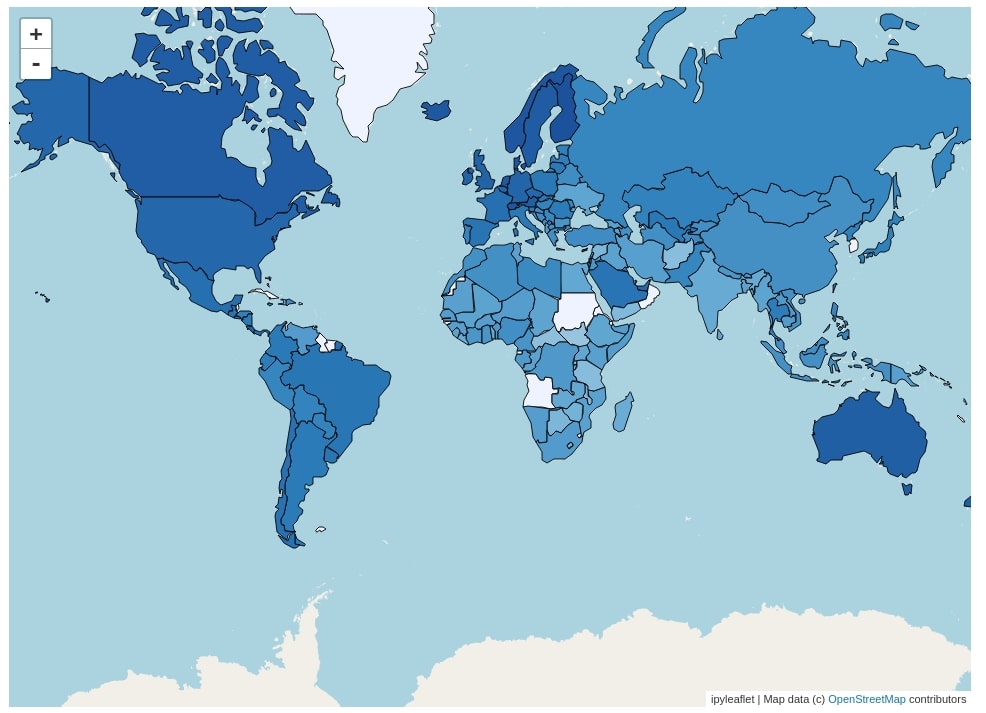
1.1 World Happiness Choropleth Map
The choropleth maps that we'll create using ipyleaflet is the world happiness choropleth map. We have used the world happiness dataset available from kaggle for this map.
- Worldwide Happiness and Other attributes dataset - It has information about each countries happiness score and many other attributes like GDP per capita, social support, healthy life expectancy, freedom to make life choices, generosity, and perception of corruption.
We suggest that you download the dataset to follow along. We'll start by loading the dataset as a pandas dataframe.
happiness_report = pd.read_csv("datasets/world_happiness_2019.csv")
happiness_report.head()
We'll also need geo JSON data for each country of the world which has information about each countries boundaries.
We have loaded that geo JSON dataset below. It has information about each country in the features key of the dictionary. The value with the features key is a list of dictionaries representing each country. One dictionary represents one country. We have moved the name of each country which is stored in the properties key of each dictionary to one level up so that they are directly available with the name key at the top level in the dictionary. This is required by the Choropleth() constructor of ipyleaflet.
with open('datasets/custom.geo.json', 'r') as f:
    geo_json_data = json.load(f)
    for d in geo_json_data["features"]:
        d["name"] = d["properties"]["name_sort"]
Below we have created a mapping dictionary which is mapping from country name to their happiness scores. We also have created one temporary dictionary which maps country name from geo JSON to country name from pandas dataframe.
There is a discrepancy in the country name between geo JSON and pandas dataframe. We have hence included small code which loops through each geo JSON country name and checks whether there is mapping for it present in the proper_name_mapping dictionary then it takes that mapping to fill value of that country name. If the country is not available in the proper_name_mapping dictionary then it'll put 0 as a happiness score for that country. This small code is written so that if the country happiness score is available with a different name then it'll be mapped to the name which is present in the geo JSON dataset.
mapping  = dict(zip(happiness_report["Country or region"].str.strip(), happiness_report["Score"]))

proper_name_mapping = {
    "Russian Federation":"Russia",
    "Czech Republic":"Czechia",
    "Macedonia, FYR":"Macedonia",
    "Central African Republic":"Central African Rep.",
    "Bosnia and Herzegovina":"Bosnia and Herz.",
    "Slovak Republic":"Slovakia",
    "Iran, Islamic Rep.":"Iran",
    "Somaliland":"Somalia",
    "Dominican Republic":"Dominican Rep.",
    "Venezuela, RB":"Venezuela",
    "Lao PDR":"Laos",
    "Yemen, Rep.":"Yemen",
    "South Sudan":"S. Sudan",
    "Papua New Guinea":"Guinea",
    "Congo, Rep.":"Congo",
    "Congo, Dem. Rep.":"Dem. Rep. Congo",
    "Cyprus, Northern":"N. Cyprus",
    "Kyrgyz Republic":"Kyrgyzstan",
    "Korea, Dem. Rep.":"South Korea",
    "Palestine (West Bank and Gaza)":"Palestinian",
    "Syrian Arab Republic":"Syria",
    "Egypt, Arab Rep.":"Egypt",
    "Gambia, The":"Gambia"

}

for d in geo_json_data["features"]:
    if d["name"] not in mapping:
        if d["name"] in proper_name_mapping.keys():
            mapping[d["name"]] = mapping[proper_name_mapping[d["name"]]]
        else:
            mapping[d["name"]] = 0

list(mapping.items())[:10]
Below we have created our first choropleth map representing the happiness score for each country of the world. We have created Map() as usual way. We have then created a choropleth layer using the Choropleth() constructor. We have given geo JSON data loaded to the geo_data parameter and mapping dictionary created to the choro_data parameter. We also have provided colormap to use. We have provided which key to use to identify features which is the name key for each feature in the dictionary. This is the reason we had earlier moved name one level up when loading the geo JSON dataset as a python dictionary.
As each map and component of ipyleaflet is ipywidgets widget we can provide style information as a dictionary to the style parameter of Choropleth().
We then need to add this choropleth layer created on top of the map using the add_layer() method of map passing it choropleth layer created.
from ipyleaflet import Choropleth, Map
from branca.colormap import linear

m = Map(zoom=2)

layer = Choropleth(
                    geo_data=geo_json_data,
                    choro_data=mapping,
                    colormap=linear.Blues_05,
                    style={'fillOpacity': 1.0, "color":"black"},
                    key_on="name")

m.add_layer(layer)
m.layout.height="700px"

m
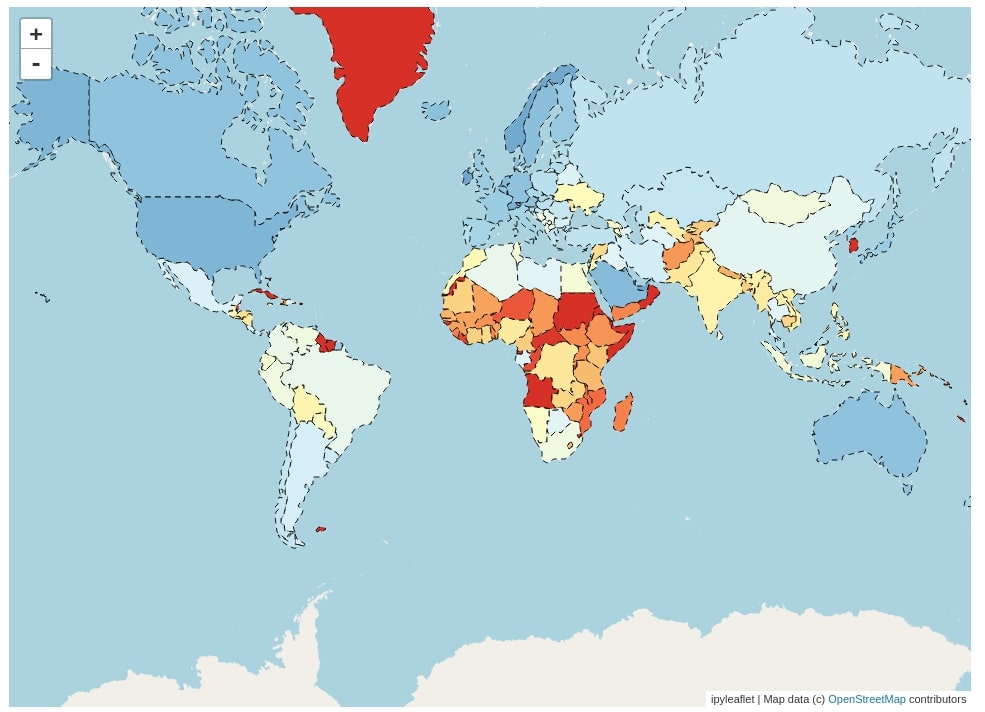
1.2 World GDP Per Capita Choropleth Map
Below we have created another Choropleth map which represents GDP per capita for each country. We have used almost the same code as the last choropleth map with the only difference in the column name used for creating mapping which is GDP per capita now.
We have created mapping the same as last time and also corrected a few mappings due to discrepancy in country name across datasets.
mapping  = dict(zip(happiness_report["Country or region"].str.strip(), happiness_report["GDP per capita"]))

for d in geo_json_data["features"]:
    if d["name"] not in mapping:
        if d["name"] in proper_name_mapping.keys():
            mapping[d["name"]] = mapping[proper_name_mapping[d["name"]]]
        else:
            mapping[d["name"]] = 0


m = Map(zoom=2)

layer = Choropleth(
                    geo_data=geo_json_data,
                    choro_data=mapping,
                    colormap=linear.RdYlBu_09,
                    style={'fillOpacity': 1.0, 'dashArray': '5, 5', 'color':"black"},
                    key_on="name")

m.add_layer(layer)
m.layout.height="700px"

m
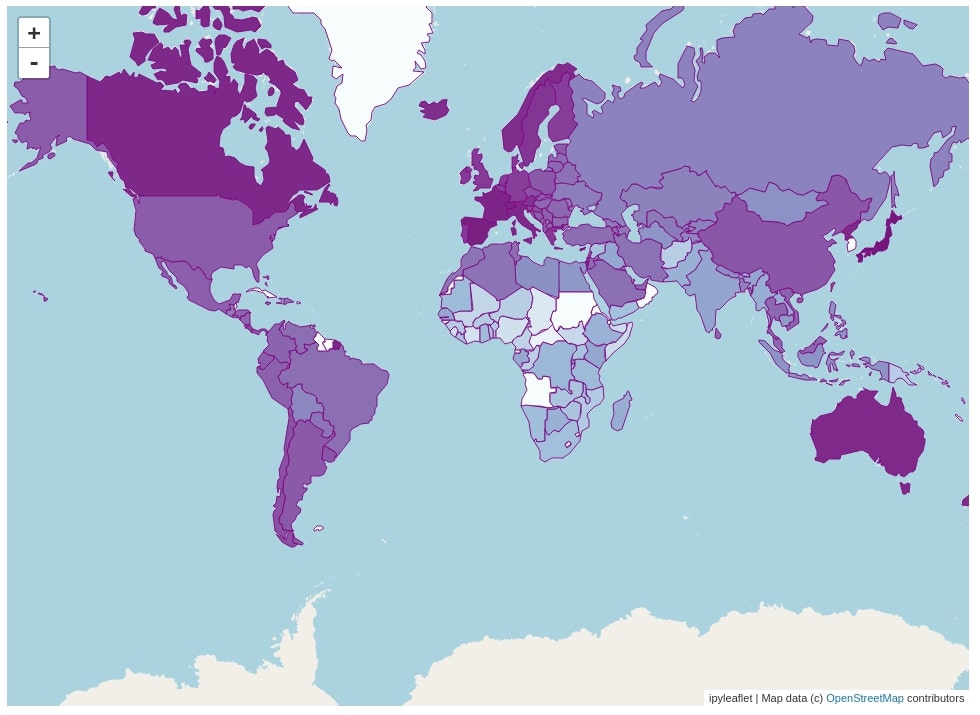
1.3 World Healthy Life Expectancy Choropleth Map
The third choropleth map that we have created using ipyleaflet is the healthy life expectancy for each country of the world. We have followed the same code and steps as the previous choropleth with the only difference in column name which is Healthy life expectancy now.
mapping  = dict(zip(happiness_report["Country or region"].str.strip(), happiness_report["Healthy life expectancy"]))

for d in geo_json_data["features"]:
    if d["name"] not in mapping:
        if d["name"] in proper_name_mapping.keys():
            mapping[d["name"]] = mapping[proper_name_mapping[d["name"]]]
        else:
            mapping[d["name"]] = 0

m = Map(zoom=2)

layer = Choropleth(
                    geo_data=geo_json_data,
                    choro_data=mapping,
                    colormap=linear.BuPu_08,
                    style={'fillOpacity': 1.0, 'color':"purple"},
                    key_on="name")

m.add_layer(layer)
m.layout.height="700px"

m
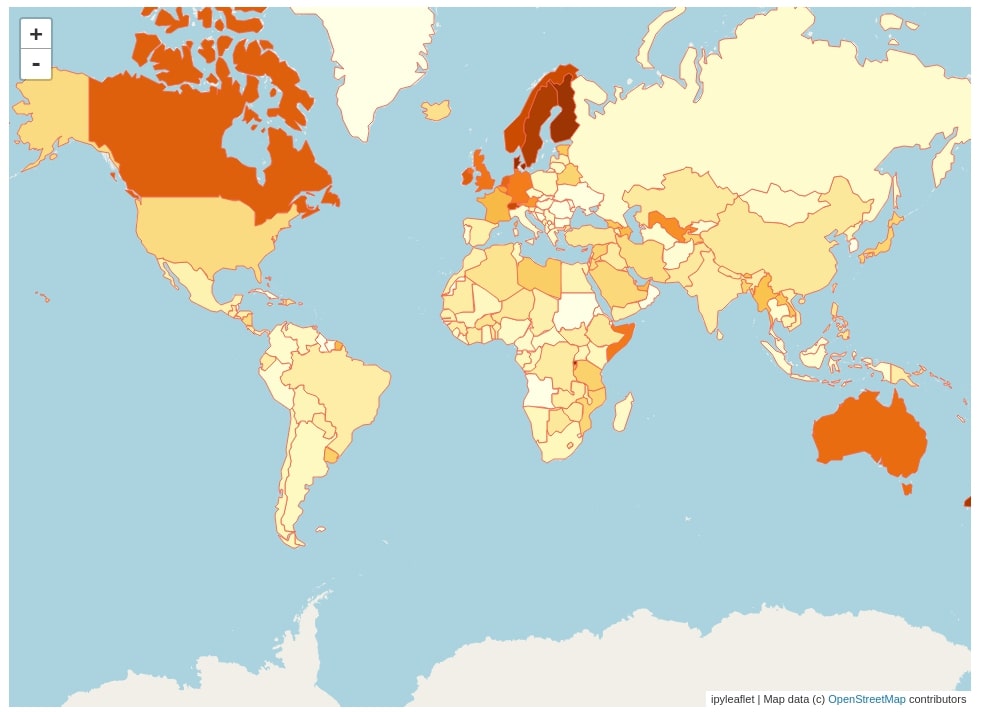
1.4 World Perception of Corruption Choropleth Map
The fourth choropleth map that we have created with ipyleaflet is a choropleth map representing Perceptions of corruption for each country of the world. It has been created with the same code as previous steps with only change in column name which is Perceptions of corruption this time from dataframe.
mapping  = dict(zip(happiness_report["Country or region"].str.strip(), happiness_report["Perceptions of corruption"]))

for d in geo_json_data["features"]:
    if d["name"] not in mapping:
        if d["name"] in proper_name_mapping.keys():
            mapping[d["name"]] = mapping[proper_name_mapping[d["name"]]]
        else:
            mapping[d["name"]] = 0

m = Map(zoom=2)

layer = Choropleth(
                    geo_data=geo_json_data,
                    choro_data=mapping,
                    colormap=linear.YlOrBr_09,
                    style={'fillOpacity': 1.0, 'color':"tomato"},
                    key_on="name")

m.add_layer(layer)
m.layout.height="700px"

m
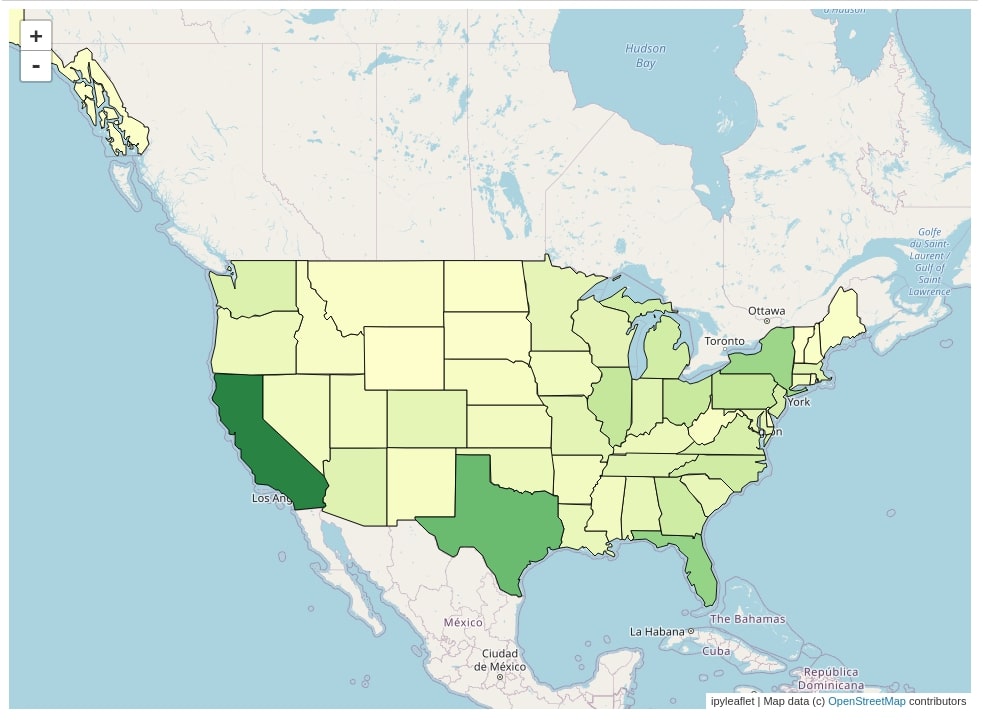
1.5 US State-wise Population Choropleth Map
The fifth choropleth map that we'll create using ipyleaflet is the US states population choropleth map. The dataset which has information about each state population is available on kaggle.
- US States Population - It has information about US states population in 2018.
We have loaded the dataset as a pandas dataframe.
us_state_pop = pd.read_csv("datasets/State Populations.csv")
us_state_pop.head()
Below we have created a choropleth map for the US state-wise population. It has the same steps as a previous choropleth map. We have loaded the geo JSON dataset which has boundary information about each US state.
We have then created mapping from state name to state population. We have then created a map object and choropleth layer with geo JSON and mapping data. We have then added the choropleth layer the same way as previous examples.
with open('datasets/us-states.json', 'r') as f:
    us_geo_json_data = json.load(f)
    for d in us_geo_json_data["features"]:
        d["name"] = d["properties"]["name"]

mapping  = dict(zip(us_state_pop["State"].str.strip(), us_state_pop["2018 Population"]))

for d in geo_json_data["features"]:
    if d["name"] not in mapping:
        mapping[d["name"]] = 0


m = Map(zoom=4, center=(43,-100))

layer = Choropleth(
                    geo_data=us_geo_json_data,
                    choro_data=mapping,
                    colormap=linear.YlGn_04,
                    style={'fillOpacity': 1.0, 'color':"black"},
                    key_on="name")

m.add_layer(layer)
m.layout.height="700px"

m
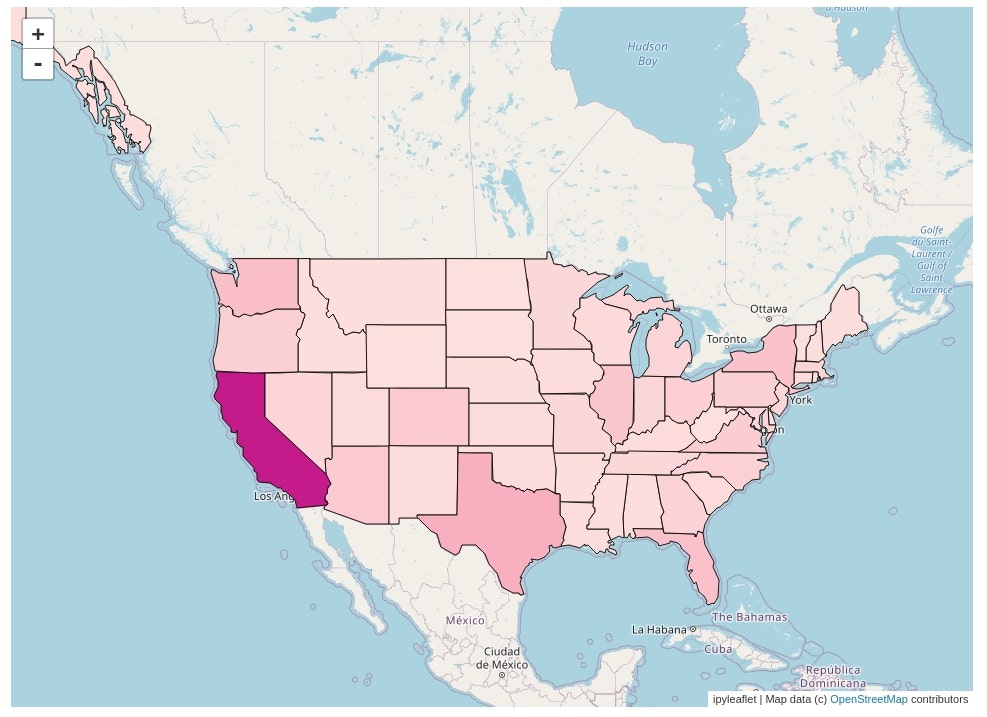
1.6 US State-wise Starbucks Store Count Choropleth Map
The sixth choropleth map that we have created using ipyleaflet is state-wise Starbucks store count for the US. The dataset which has information about Starbucks store locations is available from kaggle.
We have loaded the dataset as a pandas dataframe.
starbucks_stores = pd.read_csv("datasets/starbucks_store_locations.csv")
starbucks_stores.head()
Below we have filtered the original dataset to keep only rows where the country is the US. We have then grouped the dataset based on the state name to get a count of stores per each state.
us_stores = starbucks_stores[starbucks_stores.Country=="US"]
us_stores_statewise = us_stores.groupby("State/Province").count()[["Store Name"]].rename(columns={"Store Name":"Count"})
us_stores_statewise = us_stores_statewise.reset_index()
us_stores_statewise.head()
Below we have created a choropleth map with exactly the same steps as the previous example with the only difference that this time we have used different key in the Choropleth() constructor. The dataset has state name available as code and the geo JSON dataset also has state name available as code as a part of the id key of it. This will allow state code matching between mapping data and id key data of the geo JSON dataset.
with open('datasets/us-states.json', 'r') as f:
    us_geo_json_data = json.load(f)

mapping  = dict(zip(us_stores_statewise["State/Province"].str.strip(), us_stores_statewise["Count"]))

m = Map(zoom=4, center=(43,-100))

layer = Choropleth(
                    geo_data=us_geo_json_data,
                    choro_data=mapping,
                    colormap=linear.RdPu_03,
                    style={'fillOpacity': 1.0, 'color':"black"},
                    key_on="id",
                    hover_style={
                            'dashArray': '1', 'fillOpacity': 0.1
                        },
                    )

m.add_layer(layer)
m.layout.height="700px"

m
2. Choropleth Maps Using GeoJSON() Constructor
The second way of creating choropleth maps using ipyleaflet is using the GeoJSON() constructor. This step requires a little bit of modification to data than the previous step. We'll explain the usage of this way to construct choropleth maps with few examples.
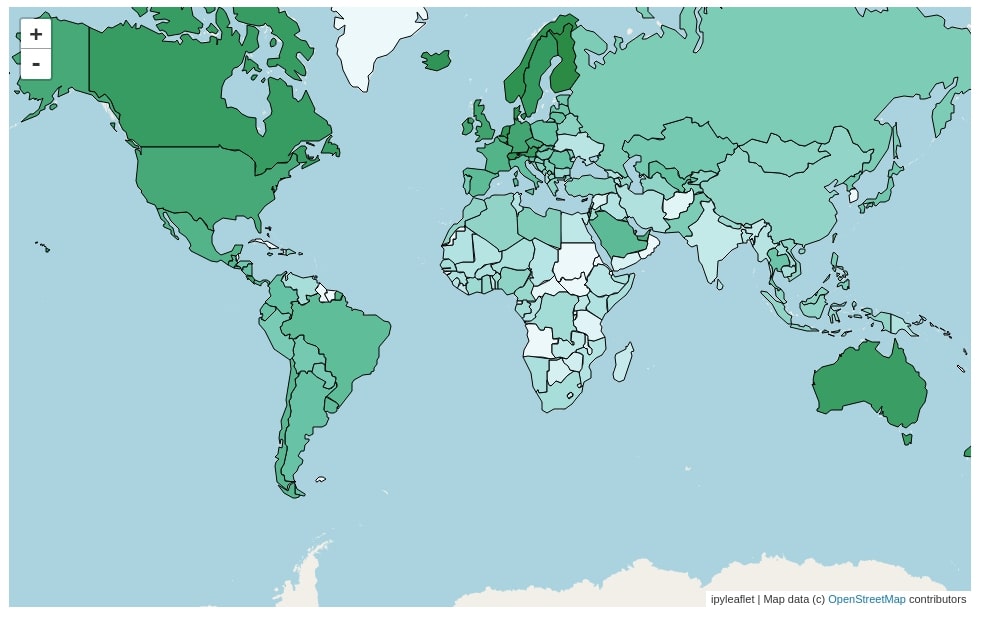
2.1 World Happiness Choropleth Map
The first choropleth map that we'll create using the GeoJSON() constructor is the happiness choropleth map for each country of the world. We'll start with loading world countries geo JSON data the same as earlier examples.
with open('datasets/custom.geo.json', 'r') as f:
    geo_json_data = json.load(f)
    for d in geo_json_data["features"]:
        d["name"] = d["properties"]["name_sort"]
Below is one extra step which is needed for creating a choropleth map with GeoJSON(). We have normalized happiness score data for each country so that score of each country is between 0-1. The reason behind doing this is that we'll be using various colormaps available from branca and it has colors mapped between values 0-1. We need to map each happiness score value to different colors according to their intensity hence we have a normalized happiness score so that branca colormap can map each happiness score to different colors.
min_val = min(happiness_report.Score.values)
max_val = max(happiness_report.Score.values)
diff = max_val-min_val

normalized_vals = (happiness_report.Score.values - min_val)/diff
normalized_vals[:20]
Below we have created mapping from country name to normalized happiness scores. We have also tried to correct the happiness score when the country name has a discrepancy between geo JSON and dataframe like previous examples.
mapping  = dict(zip(happiness_report["Country or region"].str.strip(), normalized_vals))

for d in geo_json_data["features"]:
    if d["name"] not in mapping:
        if d["name"] in proper_name_mapping.keys():
            mapping[d["name"]] = mapping[proper_name_mapping[d["name"]]]
        else:
            mapping[d["name"]] = 0

list(mapping.items())[:10]
Below we have created our world happiness choropleth map using GeoJSON(). We have created a map object first. We have then created a geo json layer using the GeoJSON() constructor passing it geo json data and a callback function which will be used to style each country.
We have declared callback function named feature_color() which returns style information for each feature (country). It maps the normalized happiness score for each country to color available for that value in BuGn_04 colormap. We have also provided information about the hover style for each feature.
from ipyleaflet import GeoJSON

def feature_color(feature):
    feature_name = feature["properties"]["name_sort"]
    return {
        'color': 'black',
        'fillColor': linear.BuGn_04(mapping[feature_name]),
    }

m = Map(zoom=2)

geo_json = GeoJSON(
    data=geo_json_data,
    style={
        'opacity': 1, 'fillOpacity': 1.0, 'weight': 1
    },
    hover_style={
        'color': 'white', 'fillOpacity': 0.95
    },
    style_callback=feature_color
)

m.add_layer(geo_json)

m.layout.height = "600px"

m
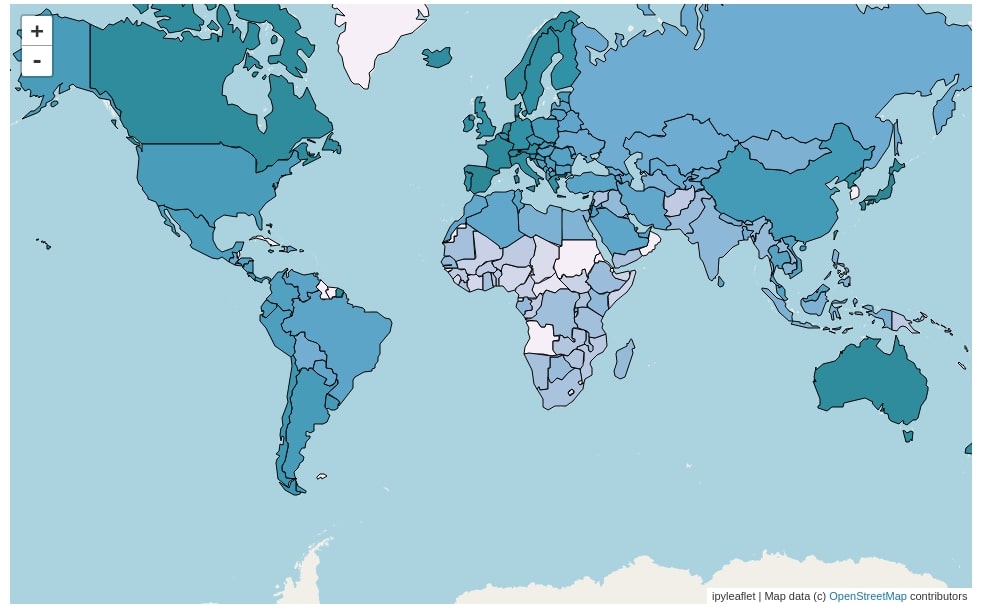
2.2 World Healthy Life Expectancy Choropleth Map
Below we have created another choropleth map using the GeoJSON() constructor but this time using Healthy life expectancy of pandas dataframe. The code is totally the same as the previous step with only a change in column name to use for the choropleth map.
min_val = min(happiness_report["Healthy life expectancy"].values)
max_val = max(happiness_report["Healthy life expectancy"].values)
diff = max_val-min_val

normalized_vals = (happiness_report["Healthy life expectancy"].values - min_val)/diff

mapping  = dict(zip(happiness_report["Country or region"].str.strip(), normalized_vals))

for d in geo_json_data["features"]:
    if d["name"] not in mapping:
        if d["name"] in proper_name_mapping.keys():
            mapping[d["name"]] = mapping[proper_name_mapping[d["name"]]]
        else:
            mapping[d["name"]] = 0

def feature_color(feature):
    feature_name = feature["properties"]["name_sort"]
    return {
        'color': 'black',
        'fillColor': linear.PuBuGn_04(mapping[feature_name]),
    }

m = Map(zoom=2)

geo_json = GeoJSON(
    data=geo_json_data,
    style={
        'opacity': 1, 'fillOpacity': 1.0, 'weight': 1
    },
    hover_style={
        'color': 'white', 'fillOpacity': 0.1
    },
    style_callback=feature_color
)

m.add_layer(geo_json)

m.layout.height = "600px"

m
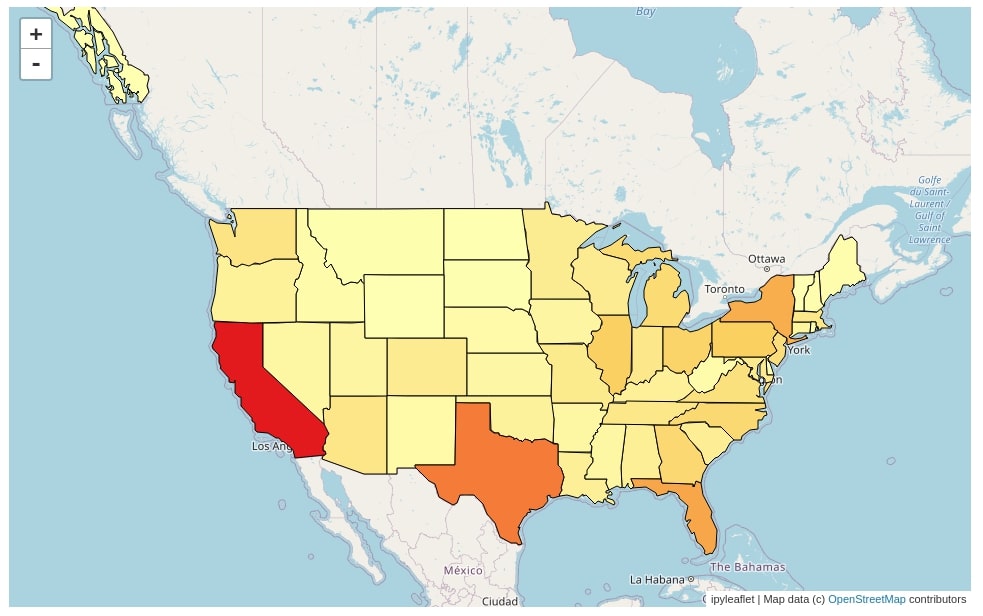
2.3 US State-wise Population Choropleth Map
The third choropleth map that we have created using GeoJSON() is the US states population choropleth map. The steps to create a map is almost the same as the previous two examples with only changes in geo json and pandas dataframe.
m = Map(zoom=4, center=(43,-100))

with open('datasets/us-states.json', 'r') as f:
    us_geo_json_data = json.load(f)
    for d in geo_json_data["features"]:
        d["name"] = d["properties"]["name"]

min_val = min(us_state_pop["2018 Population"].values)
max_val = max(us_state_pop["2018 Population"].values)
diff = max_val-min_val

normalized_vals = (us_state_pop["2018 Population"].values - min_val)/diff

mapping  = dict(zip(us_state_pop["State"].str.strip(), normalized_vals))

for d in geo_json_data["features"]:
    if d["name"] not in mapping:
        mapping[d["name"]] = 0

def feature_color(feature):
    feature_name = feature["properties"]["name"]
    return {
        'color': 'black',
        'fillColor': linear.YlOrRd_04(mapping[feature_name]),
    }

m = Map(zoom=4, center=(43,-100))

geo_json = GeoJSON(
    data=us_geo_json_data,
    style={
        'opacity': 1, 'fillOpacity': 1.0, 'weight': 1
    },
    hover_style={
        'color': 'white', 'fillOpacity': 0.0, "text":"test"
    },
    style_callback=feature_color
)

m.add_layer(geo_json)

m.layout.height = "600px"

m
This ends our small tutorial explaining ways to create choropleth maps using ipyleaflet. Please feel free to let us know your views in the comments section.
References
- Plotting Static Maps with Geopandas[Working with Geospatial Data]
- How to Convert Static Maps (Geopandas) to Interactive Maps (hvplot)?
- How to Create a Connection Map in Python [Plotly & Geopandas]?
- Cartopy - Basic Maps [Scatter Map, Bubble Map & Connection Map]
- Folium - Interactive Maps
- bqplot - Interactive Plotting Python
- ipyleaflet - Interactive Maps in Python based on leafletjs
- Plotting Maps using Bokeh
- Interactive Choropleth Maps using bqplot
- Choropleth Maps and Scatter Maps using Cufflinks
- Altair - Basic Interactive Plotting in Python
 Sunny Solanki
Sunny Solanki
Intro: Software Developer | Youtuber | Bonsai Enthusiast
About: Sunny Solanki holds a bachelor's degree in Information Technology (2006-2010) from L.D. College of Engineering. Post completion of his graduation, he has 8.5+ years of experience (2011-2019) in the IT Industry (TCS). His IT experience involves working on Python & Java Projects with US/Canada banking clients. Since 2020, he’s primarily concentrating on growing CoderzColumn.
His main areas of interest are AI, Machine Learning, Data Visualization, and Concurrent Programming. He has good hands-on with Python and its ecosystem libraries.
Apart from his tech life, he prefers reading biographies and autobiographies. And yes, he spends his leisure time taking care of his plants and a few pre-Bonsai trees.
Contact: sunny.2309@yahoo.in


![YouTube Subscribe]() Comfortable Learning through Video Tutorials?
Comfortable Learning through Video Tutorials?
If you are more comfortable learning through video tutorials then we would recommend that you subscribe to our YouTube channel.
![Need Help]() Stuck Somewhere? Need Help with Coding? Have Doubts About the Topic/Code?
Stuck Somewhere? Need Help with Coding? Have Doubts About the Topic/Code?
 Stuck Somewhere? Need Help with Coding? Have Doubts About the Topic/Code?
When going through coding examples, it's quite common to have doubts and errors.
If you have doubts about some code examples or are stuck somewhere when trying our code, send us an email at coderzcolumn07@gmail.com. We'll help you or point you in the direction where you can find a solution to your problem.
You can even send us a mail if you are trying something new and need guidance regarding coding. We'll try to respond as soon as possible.
![Share Views]() Want to Share Your Views? Have Any Suggestions?
Want to Share Your Views? Have Any Suggestions?
 Want to Share Your Views? Have Any Suggestions?
If you want to
- provide some suggestions on topic
- share your views
- include some details in tutorial
- suggest some new topics on which we should create tutorials/blogs
 choropleth-maps, ipyleaflet