Gauge Chart using Matplotlib | Python
Data visualization is an essential tool in the world of data analysis and business intelligence. Visualizing data allows us to understand complex information and identify patterns, trends, and outliers that may not be immediately apparent in raw data. One type of visualization that is particularly effective in conveying data insights is a gauge chart.
A gauge chart is a circular chart that is designed to represent a single value and compare it to a range of possible values. It typically consists of a colored arc that represents the value being measured, a needle that points to the value on the arc, and a set of markers that indicate the minimum and maximum values of the range. Gauge charts are often used to display metrics such as speed, temperature, or progress toward a goal.
In recent years, Python has become a popular language for data analysis and visualization. The Matplotlib library in Python provides a wide range of tools for creating various types of charts and visualizations, including gauge charts. With Matplotlib, you can easily create gauge charts that effectively communicate data insights in a clear and concise manner.
What Can You Learn From This Article?
In this article, we will explore how to create a gauge chart using the Python data visualization library Matplotlib. We will cover the specifics of how to use Matplotlib to create a gauge chart step by step, from creating the chart structure to customizing its appearance and adding additional elements such as labels and legends.
By the end of this article, you will have a comprehensive understanding of how to create a gauge chart using Matplotlib in Python and how to apply this powerful visualization tool to your own data analysis projects. Whether you are a data analyst, a business intelligence professional, or a data science student, the ability to create effective visualizations such as gauge charts is a valuable skill that can help you communicate insights and make informed decisions based on data.
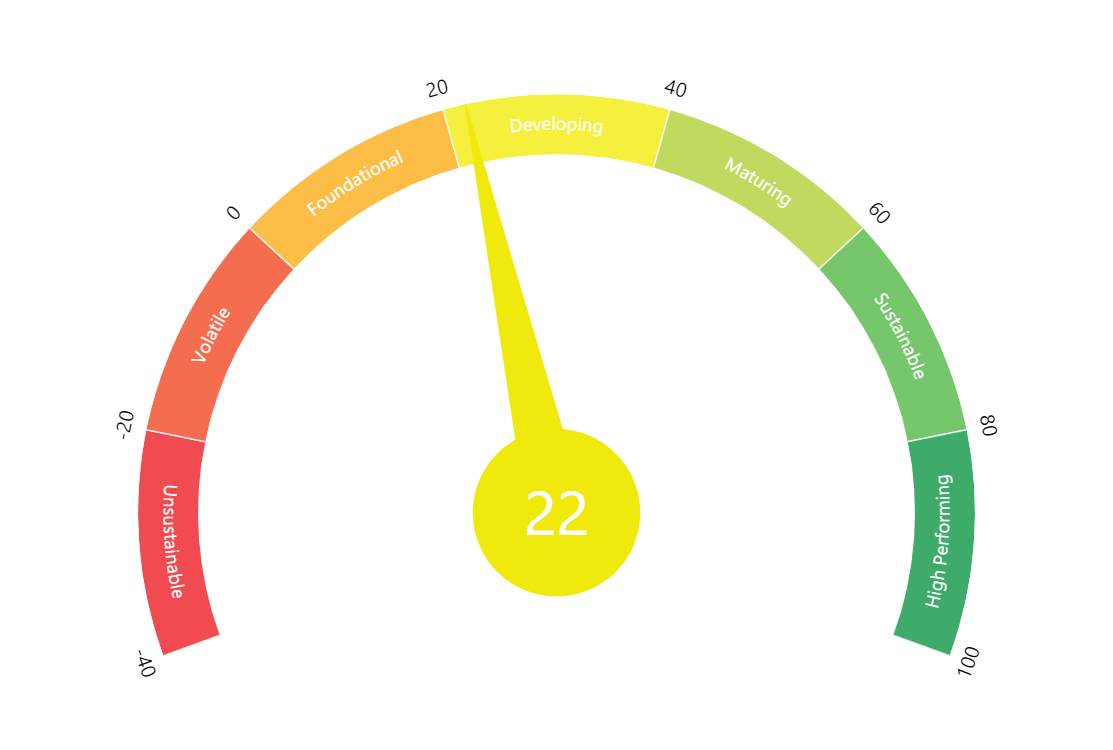
We'll try to create a gauge chart that looks like the below image using Matplotlib.
Video Tutorial
Please feel free to check below video tutorial if feel comfortable learning through videos.
First, we have imported matplotlib and printed the version that we have used in our tutorial.
import matplotlib

print("Matplotlib Version : {}".format(matplotlib.__version__))
Below, we have defined colors of sections and values that we'll use to create guage chart.
colors = ['#4dab6d', "#72c66e", "#c1da64", "#f6ee54", "#fabd57", "#f36d54", "#ee4d55"]

values = [100,80,60,40,20,0,-20, -40]

x_axis_vals = [0, 0.44, 0.88,1.32,1.76,2.2,2.64]
Below, we have created our gauge chart using Matplotlib.
The chart is a polar plot, which is a type of plot that uses polar coordinates instead of Cartesian coordinates to represent data.
The code starts by importing the necessary module from Matplotlib. Then it creates a figure object using the plt.figure() method and sets the size of the figure to 18 by 18 inches using the figsize parameter.
Next, the code creates a subplot using the fig.add_subplot() method and sets the projection to "polar" using the projection parameter. This creates a polar coordinate system for the chart.
The chart itself is created using the ax.bar() method. The x parameter specifies the location of each bar on the polar coordinate system, and the width, height, and bottom parameters set the size and position of each bar. The linewidth, edgecolor, and color parameters set the appearance of the bars.
The code then adds annotations to the chart using the plt.annotate() method. These annotations are text labels that provide additional information about the chart. Each annotation includes the text to be displayed, the location of the annotation on the polar coordinate system, and additional parameters such as rotation and font-weight. These annotations are labels for various sections of the gauge chart.
The for loop in the code adds additional annotations to the chart. This loop iterates over the values list and the loc list simultaneously using the zip() function. For each value in the values list, the loop creates an annotation at the corresponding location in the loc list. This is used to add ticks on our gauge chart.
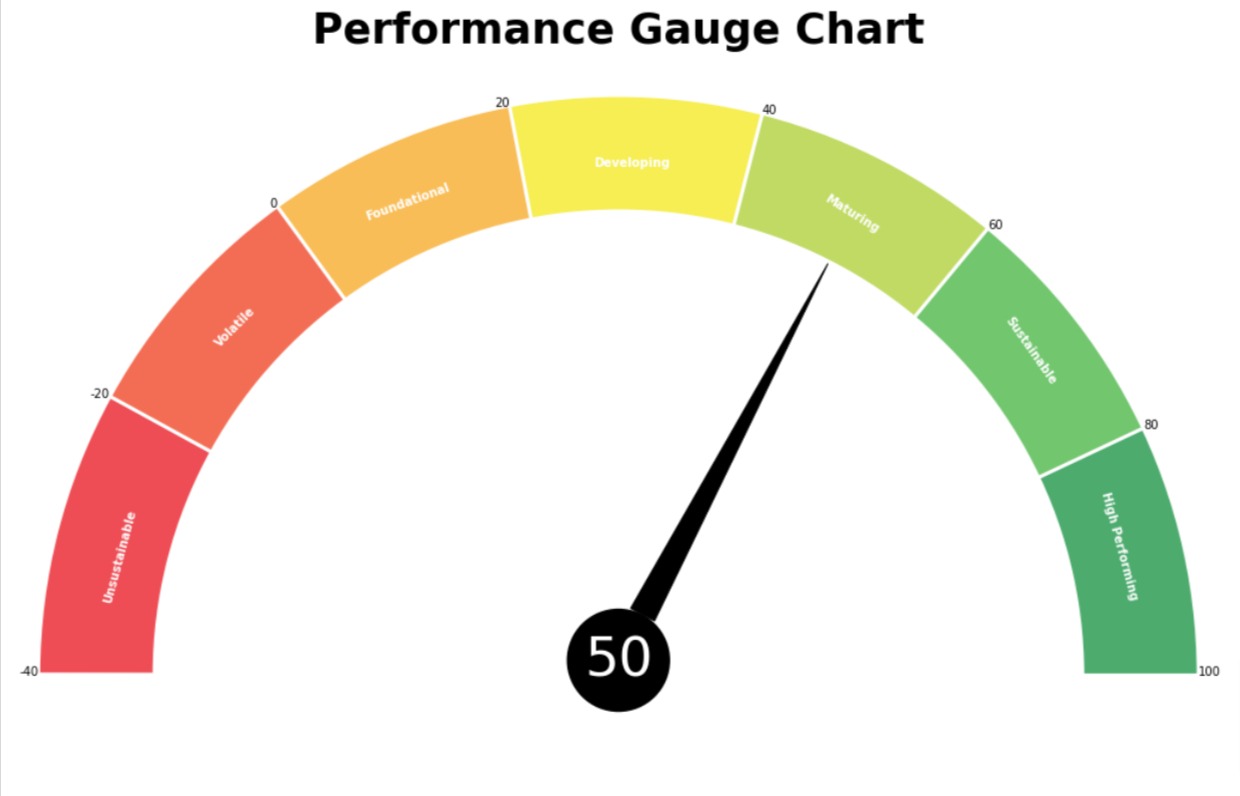
Finally, the code adds a text annotation to the center of the chart using the plt.annotate() method. This annotation includes the number 50 and a black circle with a white border. It is also used to add an arrow in the chart.
The plt.title() method sets the title of the chart to "Performance Gauge Chart" and specifies its location, padding, font size, and font weight.
Finally, the ax.set_axis_off() method hides the polar coordinate system axes, leaving only the chart and annotations visible.
import matplotlib.pyplot as plt

fig = plt.figure(figsize=(18,18))

ax = fig.add_subplot(projection="polar");

ax.bar(x=[0, 0.44, 0.88,1.32,1.76,2.2,2.64], width=0.5, height=0.5, bottom=2,
       linewidth=3, edgecolor="white",
       color=colors, align="edge");

plt.annotate("High Performing", xy=(0.16,2.1), rotation=-75, color="white", fontweight="bold");
plt.annotate("Sustainable", xy=(0.65,2.08), rotation=-55, color="white", fontweight="bold");
plt.annotate("Maturing", xy=(1.14,2.1), rotation=-32, color="white", fontweight="bold");
plt.annotate("Developing", xy=(1.62,2.2), color="white", fontweight="bold");
plt.annotate("Foundational", xy=(2.08,2.25), rotation=20, color="white", fontweight="bold");
plt.annotate("Volatile", xy=(2.46,2.25), rotation=45, color="white", fontweight="bold");
plt.annotate("Unsustainable", xy=(3.0,2.25), rotation=75, color="white", fontweight="bold");

for loc, val in zip([0, 0.44, 0.88,1.32,1.76,2.2,2.64, 3.14], values):
    plt.annotate(val, xy=(loc, 2.5), ha="right" if val<=20 else "left");

plt.annotate("50", xytext=(0,0), xy=(1.1, 2.0),
             arrowprops=dict(arrowstyle="wedge, tail_width=0.5", color="black", shrinkA=0),
             bbox=dict(boxstyle="circle", facecolor="black", linewidth=2.0, ),
             fontsize=45, color="white", ha="center"
            );


plt.title("Performance Gauge Chart", loc="center", pad=20, fontsize=35, fontweight="bold");

ax.set_axis_off();
This ends our small tutorial explaining how to create a gauge chart using "Matplotlib". A gauge chart is a type of chart that displays a single value and its relation to a predefined range. The article provides a step-by-step guide to creating a polar plot using Matplotlib, setting the size and style of the chart, and adding annotations to it. The code for creating the chart includes examples of how to set the appearance of the chart, including color, font size, and font weight. The article is helpful for those who want to learn how to create a gauge chart using Matplotlib and provides an easy-to-follow guide with detailed explanations.
References
 Sunny Solanki
Sunny Solanki
Intro: Software Developer | Youtuber | Bonsai Enthusiast
About: Sunny Solanki holds a bachelor's degree in Information Technology (2006-2010) from L.D. College of Engineering. Post completion of his graduation, he has 8.5+ years of experience (2011-2019) in the IT Industry (TCS). His IT experience involves working on Python & Java Projects with US/Canada banking clients. Since 2020, he’s primarily concentrating on growing CoderzColumn.
His main areas of interest are AI, Machine Learning, Data Visualization, and Concurrent Programming. He has good hands-on with Python and its ecosystem libraries.
Apart from his tech life, he prefers reading biographies and autobiographies. And yes, he spends his leisure time taking care of his plants and a few pre-Bonsai trees.
Contact: sunny.2309@yahoo.in


![YouTube Subscribe]() Comfortable Learning through Video Tutorials?
Comfortable Learning through Video Tutorials?
If you are more comfortable learning through video tutorials then we would recommend that you subscribe to our YouTube channel.
![Need Help]() Stuck Somewhere? Need Help with Coding? Have Doubts About the Topic/Code?
Stuck Somewhere? Need Help with Coding? Have Doubts About the Topic/Code?
 Stuck Somewhere? Need Help with Coding? Have Doubts About the Topic/Code?
When going through coding examples, it's quite common to have doubts and errors.
If you have doubts about some code examples or are stuck somewhere when trying our code, send us an email at coderzcolumn07@gmail.com. We'll help you or point you in the direction where you can find a solution to your problem.
You can even send us a mail if you are trying something new and need guidance regarding coding. We'll try to respond as soon as possible.
![Share Views]() Want to Share Your Views? Have Any Suggestions?
Want to Share Your Views? Have Any Suggestions?
 Want to Share Your Views? Have Any Suggestions?
If you want to
- provide some suggestions on topic
- share your views
- include some details in tutorial
- suggest some new topics on which we should create tutorials/blogs
 gauge-chart, matplotlib