Machine Learning Tutorials
The term 'machine learning' (ML) describes a system's capacity to gather and synthesize knowledge through extensive observation, as well as to develop and extend itself by picking up new information rather than having it preprogrammed into it. At CoderzColumn, you get a glimpse of the vast Machine Learning Field. We cover various concepts through tutorials. The concepts are:
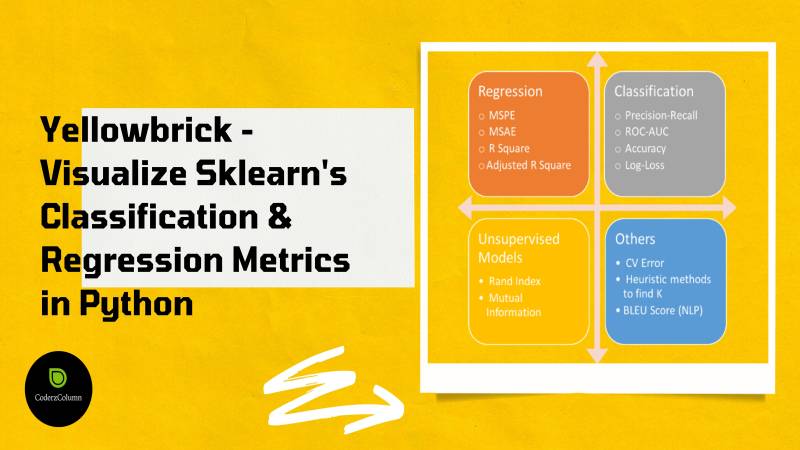
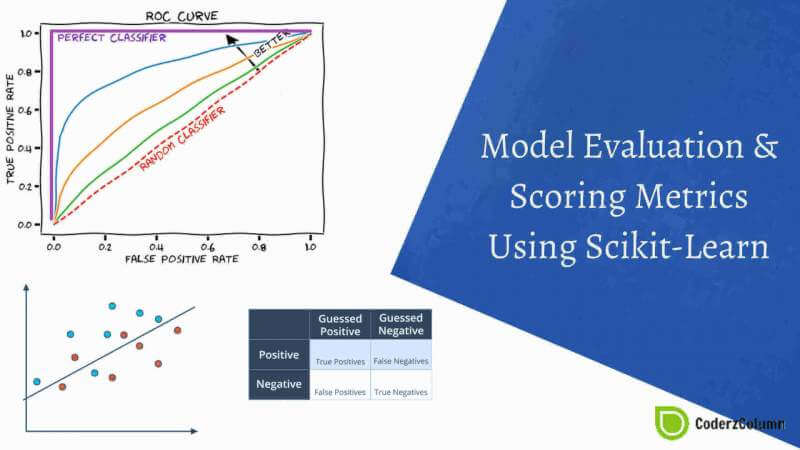
- Visualize ML Metrics
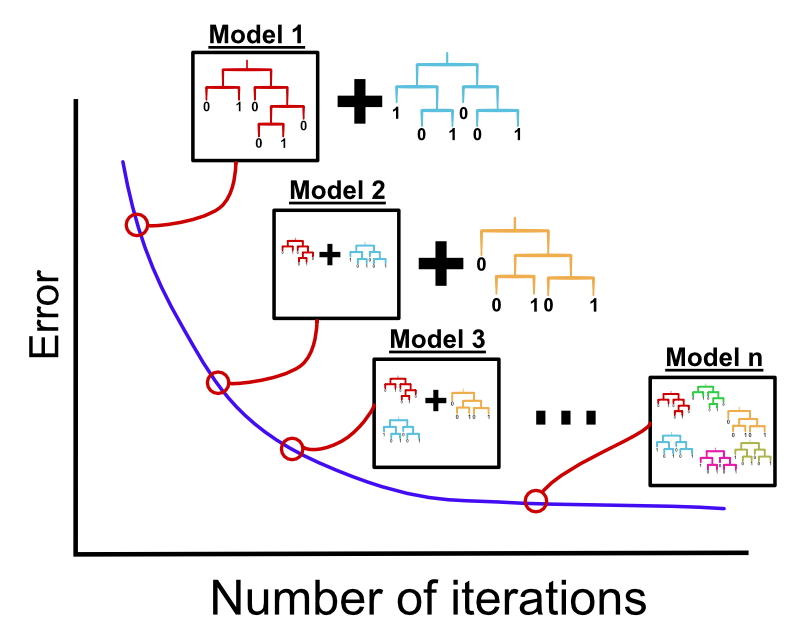
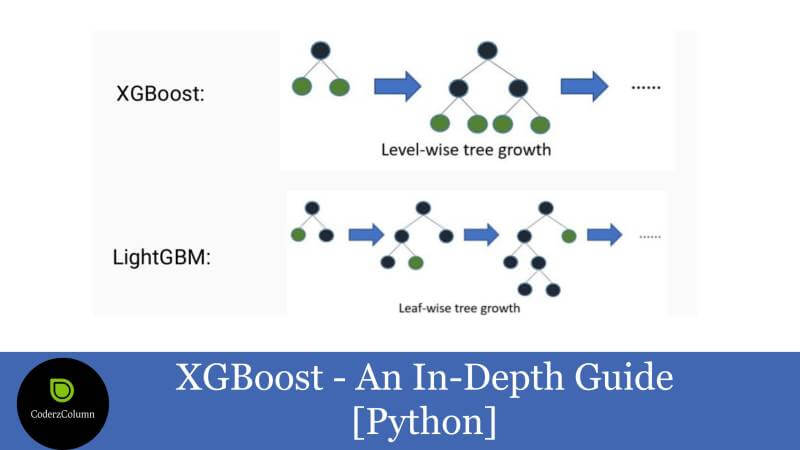
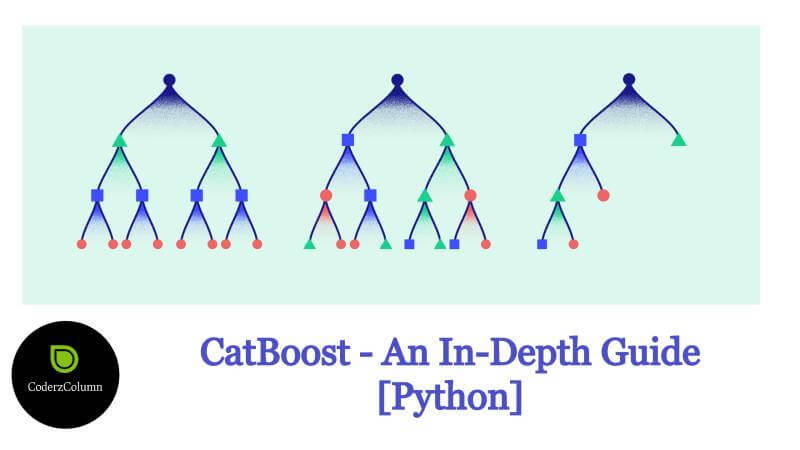
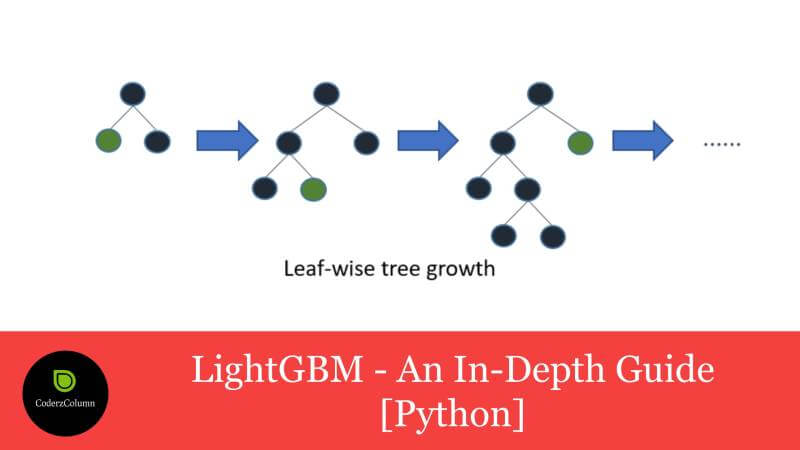
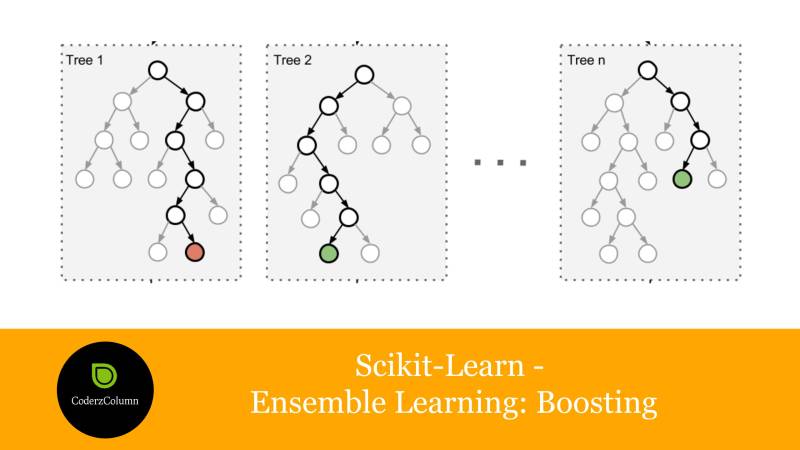
- Gradient Boosted Decision Trees
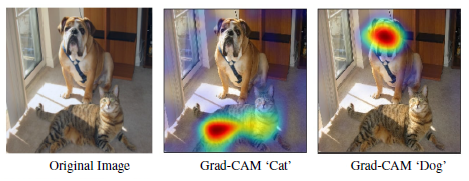
- Interpret Predictions Of ML Models
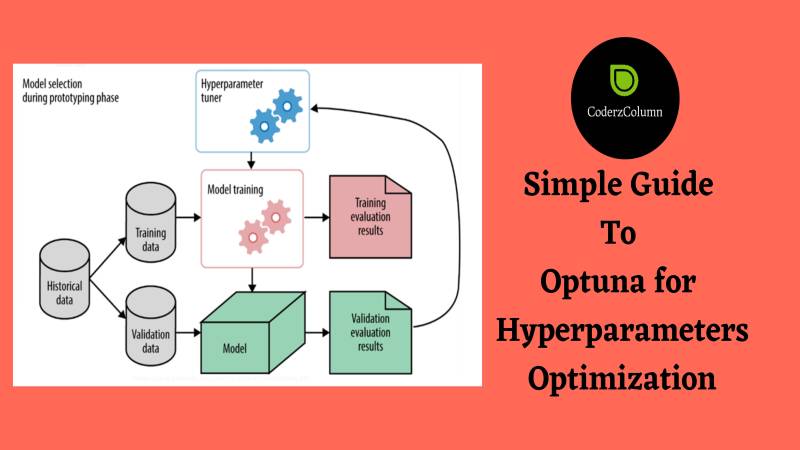
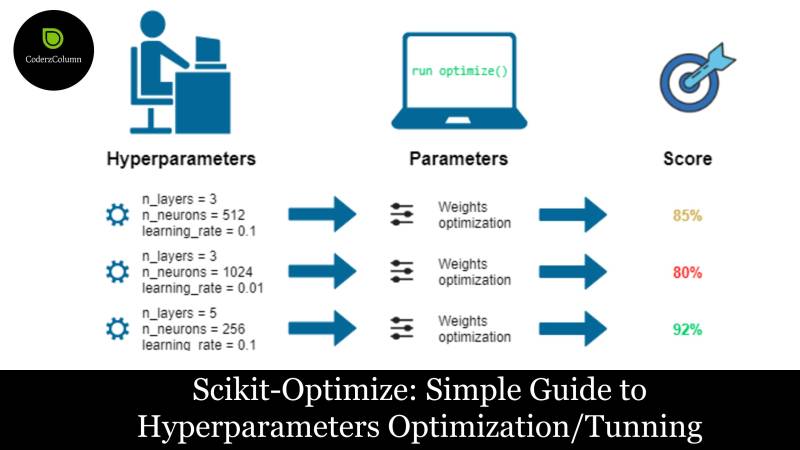
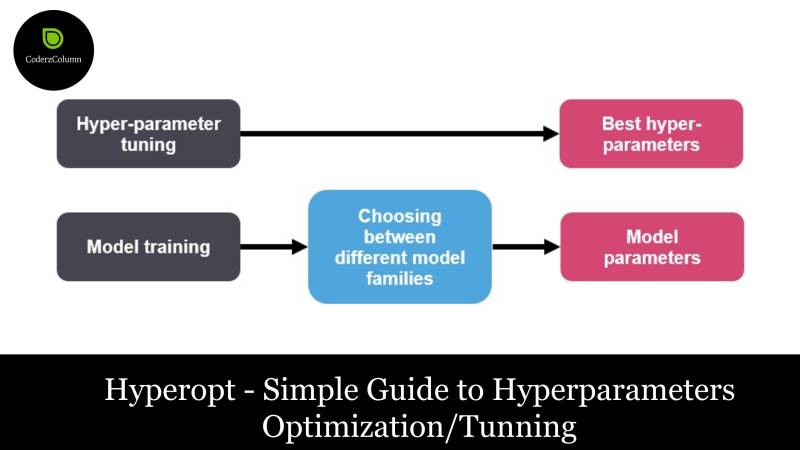
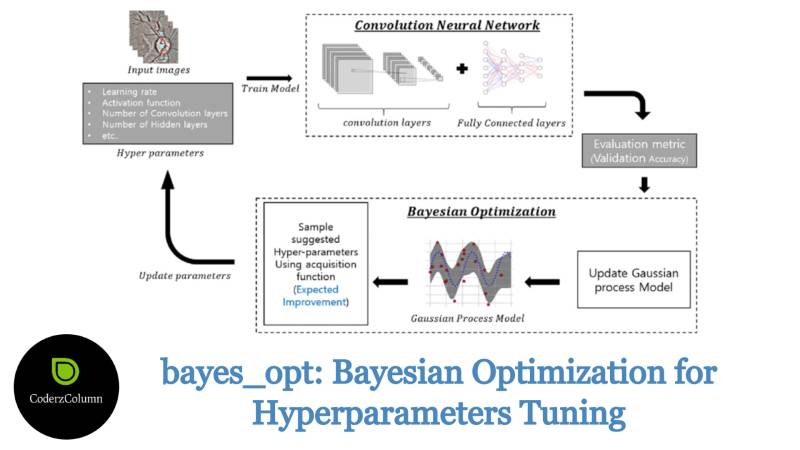
- Hyperparameters Tuning / Optimization
For an in-depth understanding of the above concepts, check out the sections below.
 Sunny Solanki


![How to Use eli5 to Interpret ML Models and their Predictions [Python]?](/static/tutorials/machine_learning/article_image/How%20to%20Use%20eli5%20to%20Understand%20sklearn%20Models%2C%20their%20Performance%2C%20and%20their%20Predictions.jpg)
![How to Use LIME to Interpret Predictions of ML Models [Python]?](/static/tutorials/machine_learning/article_image/How%20to%20Use%20LIME%20to%20Understand%20sklearn%20Models%20Predictions.jpg)
![SHAP Values - Interpret Machine Learning Model Predictions using Game Theoretic Approach [Python]](/static/tutorials/machine_learning/article_image/SHAP%20-%20Explain%20Machine%20Learning%20Model%20Predictions%20using%20Game%20Theoretic%20Approach.jpg)
![interpret-text - Interpret NLP Models and Their Predictions [Python]](/static/tutorials/machine_learning/article_image/interpret-text%20-%20Interpret%20NLP%20Models%20and%20Their%20Predictions%20%5BPython%5D.jpg)
![dice-ml - Diverse Counterfactual Explanations for ML Models [Python]](/static/tutorials/machine_learning/article_image/dice-ml%20-%20Diverse%20Counterfactual%20Explanations%20for%20ML%20Models.jpg)
![interpret-ml - Explain Machine Learning Models And Their Predictions [Python]](/static/tutorials/machine_learning/article_image/interpret-ml%20-%20Explain%20Machine%20Learning%20Models%20And%20Their%20Predictions%20%5BPython%5D.jpg)
![Yellowbrick - Text Data Visualizations [Python]](/static/tutorials/machine_learning/article_image/Yellowbrick%20-%20Text%20Data%20Visualizations%20%5BPython%5D.jpg)
![Treeinterpreter - Interpreting Tree-Based Model's Prediction of Individual Sample [Python]](/static/tutorials/machine_learning/article_image/Treeinterpreter%20-%20Interpreting%20Tree-Based%20Model's%20Prediction%20of%20Individual%20Sample.jpg)