CatBoost - An In-Depth Guide [Python API]
> What is CatBoost?
Catboost is an open-source machine learning library that provides a fast and reliable implementation of gradient boosting on decision trees algorithm (gradient boosted decision trees). Gradient boosted trees is a type of gradient booting machines algorithm where all estimators of ensemble are decision trees. It combines predictions of these weak tree learners to predict final output.
It can be used for classification, regression, ranking, and other machine learning tasks.
Catboost is developed by Yandex researchers and developers. It's used by various companies for tasks like search, recommendation systems, personal assistants, self-driving cars, weather prediction, etc.
> Why Use "CatBoost" over Other Python Gradient Boosting Libraries?
Catboost provided support for handling categorical and text features of the data without the developer needing to handle them separately.
Catboost also provides support for grid search and randomized search which lets us try out a list of values for parameters to find the best combination of parameters that gives the best results.
Catboost algorithm gives quite a good accuracy with default parameter settings.
Apart from this, catboost also provides support for running the training process on GPU. It even lets us run the training process on multiple GPUs with simple configurations.
Catboost provides API in Python and R.
> What Can You Learn From This Article?
As a part of this tutorial, we have explained how to use Python library CatBoost to solve machine learning tasks (Classification & Regression). We have explained majority of CatBoost API with simple and easy-to-understand examples.
Apart from training models & making predictions, we have explained concepts like hyperparameters tuning, cross-validation, saving & loading model, recovering from interrupted training, early stopping to avoid overfitting, creating custom loss function, creating a custom evaluation metric, etc.
All our examples are trained on toy datasets (structured - tabular) available from scikit-learn to keep things simple and easy to grasp.
One of our sections at last also explains how to use CatBoost with text datasets.
Tutorial is designed to get individuals started with using CatBoost and learn end-to-end Python API of Catboost.
> Which Other Python Libraries Provides Implementation Of Gradient Boosted Trees?
> How to Install CatBoost?
- PIP
- pip install -U catboost
- Conda
- conda install catboost
Below, we have listed important sections of tutorial to give an overview of the material covered. We know that the list below is big but you can skip some sections of tutorial which has a theory or repeat example of some concepts. We have included NOTE in those sections so you can skip them to complete tutorial faster. You can then refer to those sections in your free time or as per need.
Important Sections Of Tutorial
- Load Datasets for Tutorial
- Boston Housing Dataset for Regression Tasks
- Breast Cancer Dataset for Binary Classification Tasks
- Wine Dataset for Multi-Class Classification Tasks
- CatBoost Models/Estimators at High-Level
- CatBoost: Regression Example
- 3.1 Train Simple CatBoost Model, Make Predictions, and Evaluate Performance of Model
- 3.2 Important Attributes & Methods of CatBoost Object
- 3.3 How to Perform Hyperparameters Tunning with CatBoost?
- Grid Search Example
- Random Search Example
- 3.4 Important Parameters of CatBoost() Constructor
- 3.5 Important Parameters of Catboost.fit() Methods
- CatBoost: Regression (Pool Data Structure to Represent Datasets)
- Important Parameters Of "Pool()" Constructor
- CatBoost: Binary Classification Example
- CatBoost: Multi-Class Classification Example
- CatBoostRegressor (Scikit-Learn Like API)
- CatBoostClassifier (Scikit-Learn Like API)
- Binary Classification Example
- Multi-Class Classification Example
- Cross Validation
- Saving and Loading Model
- Plotting Functionalities in CatBoost
- Visualize Training Loss and Metric Values
- Visualize Individual Tree of Ensemble using "plot_tree()"
- Visualize Important Statistics of Data Features using "calc_feature_statistics()"
- Visualize Individual Predictions using "plot_predictions()"
- Partial Dependence Plot of Features using "plot_partial_dependence()"
- Visualization to Compare Performance Of Different Models using "compare()"
- How to Compare Performance Of Different CatBoost Models?
- Recovering Interrupted Training using Snapshots
- Early Stop Training to Avoid Overfitting
- Monotonic Constraints
- Custom Evaluation Metric Function
- Custom Objective/Loss Function
- Text Data Example
- GPU Support
We'll start by importing the necessary libraries.
import pandas as pd
import numpy as np

import matplotlib.pyplot as plt

import warnings

warnings.filterwarnings("ignore")
pd.set_option("display.max_columns", 50)

import catboost
import sklearn

print("CatBoost Version     : ", catboost.__version__)
print("Scikit-Learn Version : ", sklearn.__version__)
1. Load Datasets 
We'll be using the below-mentioned three different datasets which are available from sklearn as a part of this tutorial for explanation purposes.
- Boston Housing Dataset: It's a regression problem dataset which has information about the various attribute of houses in Boston and their price in dollar. This will be used for regression tasks.
- Breast Cancer Dataset: It's a classification dataset which has information about two different types of tumor. It'll be used for explaining binary classification tasks.
- Wine Dataset - It's a classification dataset which has information about ingredients used in three different types of wines. It'll be used for explaining multi-class classification tasks.
We have loaded all three datasets mentioned one by one below. We have printed descriptions of datasets which gives us an overview of dataset features and size. We have even loaded each dataset as a pandas data frame and displayed the first few samples of data.
Boston Housing Dataset
from sklearn.datasets import load_boston

boston = load_boston()

for line in boston.DESCR.split("\n")[5:29]:
    print(line)

boston_df = pd.DataFrame(data=boston.data, columns = boston.feature_names)
boston_df["Price"] = boston.target

boston_df.head()
Breast Cancer Dataset
from sklearn.datasets import load_breast_cancer

breast_cancer = load_breast_cancer()

for line in breast_cancer.DESCR.split("\n")[5:31]:
    print(line)

breast_cancer_df = pd.DataFrame(data=breast_cancer.data, columns = breast_cancer.feature_names)
breast_cancer_df["TumorType"] = breast_cancer.target

breast_cancer_df.head()
Wine Dataset
from sklearn.datasets import load_wine

wine = load_wine()

for line in wine.DESCR.split("\n")[5:29]:
    print(line)

wine_df = pd.DataFrame(data=wine.data, columns = wine.feature_names)
wine_df["WineType"] = wine.target

wine_df.head()
2. CatBoost Models at High-Level (High-Level API)
CatBoost provides three different estimators to perform classification and regression tasks.
- CatBoost - It's a universal estimator which can handle both classification and regression datasets with settings.
- CatBoostRegressor - It is an estimator with scikit-learn like API designed to work with regression datasets.
- CatBoostClassifier - It is an estimator with scikit-learn like API designed to work with classification datasets.
3. CatBoost: Regression Example 
The simplest way to train a model in Catboost is by initializing the CatBoost estimator. The CatBoost constructor accepts only one parameter named params which is a dictionary of parameters to be used to create an estimator. It has one main parameter named loss_function based on the value of this parameter it determines whether the task is regression or classification. We can create a CatBoost estimator without passing any parameter and it'll create an estimator with loss function as root mean squared error which is used for regression tasks. All the parameters have some defined default values which we'll list down at the end of this section. By default, the CatBoost estimator trains for 1000 iterations creating 1000 trees. It's an alias to the n_estimators parameter which limits the number of trees.
3.1 Train Simple CatBoost Model, Make Predictions and Evaluate Performance 
Below we have created our first CatBoost estimator using the RMSE loss function. We have passed an iteration value of 100 to train it for 100 iterations. The verbose value of 10 will print results at every 10 iterations. The training process will create an ensemble of 100 trees.
In the next cell, we have divided the Boston housing dataset into the train (90%) and test (10%) sets using scikit-learn's train_test_split() function.
from catboost import CatBoost

booster = CatBoost(params={'iterations':100, 'verbose':10, 'loss_function':'RMSE'})

booster
from sklearn.model_selection import train_test_split

X_train, X_test, Y_train, Y_test = train_test_split(boston.data, boston.target, train_size=0.9, random_state=123)

X_train.shape, X_test.shape, Y_train.shape, Y_test.shape
We are now training our gradient boosting estimator created from previous steps by calling the fit() method on it passing it train data and labels. The fit() method accepts many other parameters which we'll explain as we go ahead with the tutorial. We have then called the set_feature_names() method which can be used to set feature names for each column of data.
booster.fit(X_train, Y_train)
booster.set_feature_names(boston.feature_names)
The CatBoost estimator provides the method predict() which accepts feature values and returns model predictions. We have below calculated predictions for train and test datasets.
test_preds = booster.predict(X_test)
train_preds = booster.predict(X_train)

test_preds[:5], train_preds[:5]
We can evaluate model performance using the eval_metric() method available from the utils module of catboost. The method accepts actual labels, predictions, and a list of metrics to evaluate. We'll later list down a list of available metrics with catboost. We have evaluated the R2 metric on both train and test sets below.
from catboost.utils import eval_metric

print("Test  R2 : %.2f"%eval_metric(Y_test, test_preds, "R2")[0])
print("Train R2 : %.2f"%eval_metric(Y_train, train_preds, "R2")[0])
3.2 Important Attributes & Methods of "CatBoost" Object 
We'll now list down a list of important attributes and methods of the CatBoost estimator. Please make a note that this is not a list of all possible attributes and methods. There are many more methods which we'll cover later as well.
Attributes
- best_score_ - It returns the best score of the model.
- classes_ - It returns list of classes for classification problem.
- feature_names_ - It returns list of feature names.
- feature_importances_ - It returns the importance of each feature per algorithm.
- learning_rate_ - It returns the learning rate of the algorithm.
- random_seed_ - It returns a random seed from which initial model weights were assigned.
- tree_count_ - It returns the number of trees in the ensemble.
- n_features_in_ - It returns the number of features used to train the model.
- evals_result - It returns dictionary of evaluation. If we have provided an evaluation set then evaluation results for it will be included.
print("Best Score                : ",booster.best_score_)
print("\nList of Target Classses : ",booster.classes_)
print("\nData Feature Names      : ",booster.feature_names_)
print("\nFeature Importance      : ", booster.feature_importances_)
print("\nLearning Rate           : ",booster.learning_rate_)
print("\nRandom Seed             : ",booster.random_seed_)
print("\nNumber of Trees         : ",booster.tree_count_)
print("\nNumber of Features      : ",booster.n_features_in_)
Methods
- get_best_score() - It returns best score of the estimator.
- get_params() - It returns parameters which were given as dictionary when creating CatBoost estimator and their values as dictionary.
- get_all_params() - It returns list of all parameters of CatBoost estimator and their values as dictionary.
- get_cat_feature_indices() - It returns list of indices which has categorical features.
- get_feature_importance() - It returns feature importance of individual feature according to trained model.
- shrink(ntree_end, ntree_start=0) - It accepts two arguments which are end tree and starts tree to shrink ensemble to include only trees that come in that index range discarding all other trees.
- set_params() - It can be used to set parameters of the estimator. Please make a note that this method will only work before the training model.
- calc_leaf_indexes(data, ntree_start=0,ntree_end=0) - It takes as input data and returns index of leaf in each tree which was used to make prediction for sample. The output of this function will be n_samples x n_trees. It'll return all trees' leaf index for a sample.
- get_leaf_values() - It returns actual leaf values of the trees in ensemble.
- get_leaf_weights() - It returns leaf weights for each leaf of the trees in the ensemble.
leaf_indices = booster.calc_leaf_indexes(X_train)

print("Leaf Indices Size : ",leaf_indices.shape)

leaf_indices[:2]
print("Parameters Passed When Creating Model : ",booster.get_params())

print("\nAll Model Parameters                : ",booster.get_all_params())
print("\nBest Score                  : ",booster.get_best_score())
print("\nCategorical Feature Indices : ",booster.get_cat_feature_indices())
print("\nFeature Importances        : ",booster.get_feature_importance())
print("\nLeaf Values Shape   : ", booster.get_leaf_values().shape)
print("\nLeaf Values         : ", booster.get_leaf_values()[:10])
print("\nLeaft Weights Shape : ",booster.get_leaf_weights().shape)
print("\nLeaft Weights       : ",booster.get_leaf_weights()[:10])
Shrink Estimator by Reducing Number of Trees in Ensemble
Below we have explained how we can use the shrink() method. We have reduced our original ensemble from 100 to 50 trees. We have then evaluated the R2 metric on the train and test sets. We can notice a visible change in the R2 score by decreasing the number of trees in the ensemble.
booster.shrink(ntree_end=50)

test_preds = booster.predict(X_test)
train_preds = booster.predict(X_train)

print("Test  R2 : %.2f"%eval_metric(Y_test, test_preds, "R2")[0])
print("Train R2 : %.2f"%eval_metric(Y_train, train_preds, "R2")[0])
3.3 How to Perform Hyperparameters Tunning with CatBoost? 
3.3.1 Grid Search
The CatBoost estimator lets us perform grid search as well using the grid_search() method of the estimator. In order to do a grid search, we need to create an estimator without setting parameters that we want to try. We then call the grid_search() method on the estimator instance by giving it parameters dictionary and data to try different parameter combinations.
If you are interested in learning about grid search and randomized search from scikit-learn then please feel free to check our tutorial on the same.
Important Parameters of "grid_search()"
- param_grid - It accepts a dictionary of parameter names and a list of values to try for that parameters.
- X - It accepts numpy array, pandas dataframe, 'catboost.Pool' data structure which has feature values.
- y - It accepts target labels of data. If we are using the catboost.Pool data structure which has labels info then we don't need to pass this parameter value.
- cv - It accepts integer or sklearn data splitter classes (KFold, StratifiedKFold, ShuffleSplit, StratifiedShuffleSplit). If we give an integer as input then that many folds of data will be created for training. The default value of the parameter is 3.
- calc_cv_statistics - It accepts boolean value specifying whether to calculate cross-validation statistics. The default is True.
- refit - It accepts boolean values specifying whether to train a model using the best parameter setting found using cross-validation. The default is True.
- stratified - It performs stratified partition of the dataset so that class proportion is maintained in sets. The default is True.
The method returns a dictionary with two keys.
- Best parameter settings.
- Cross-validation results.
Below we are explaining how we can perform a grid search with an example. We are trying different values of parameters iterations, learning_rate and booststrap_type. We are using training data created from the Boston dataset earlier. We have then evaluated the performance of the estimator with the best setting by calculating the R2 score on the train and test dataset.
booster = CatBoost()

params = {
            'iterations':[10,50],
            'learning_rate':[0.01, 0.1],
            'bootstrap_type':['Bayesian', 'Bernoulli', 'No']
}

search_results = booster.grid_search(params, X_train, Y_train, cv=5)

print("\nBest Params : ", search_results['params'])

test_preds = booster.predict(X_test)
train_preds = booster.predict(X_train)

print("\nTest  R2 : %.2f"%eval_metric(Y_test, test_preds, "R2")[0])
print("Train R2 : %.2f"%eval_metric(Y_train, train_preds, "R2")[0])
cv_results = pd.DataFrame(search_results["cv_results"])

cv_results.head()
3.3.2 Randomized Search
The CatBoost also lets us perform a randomized search which is faster compared to grid search which only tries a few parameter settings than trying all possible combinations. We can perform a randomized search using randomized_search() of the CatBoost estimator. The randomized_search() method has the same API as that of the grid_search() method with one extra parameter named n_iter which accepts integer values specifying how many random combinations of parameters to try. The default value of this parameter is 10.
Below we have explained how we can perform a randomized search. We are trying different values of parameters iterations, learning_rate and booststrap_type. We are using training data created from the Boston dataset earlier. We have then evaluated the performance of an estimator with the best setting by calculating the R2 score on the train and test dataset.
booster = CatBoost()

params = {
            'iterations':[5,10,50,100],
            'learning_rate':[0.01, 0.03, 0.1,1.0],
            'bootstrap_type':['Bayesian', 'Bernoulli', 'MVS', 'No']
}

search_results = booster.randomized_search(params, X_train, Y_train, cv=5, n_iter=8)

print("\nBest Params : ", search_results['params'])

test_preds = booster.predict(X_test)
train_preds = booster.predict(X_train)

print("\nTest  R2 : %.2f"%eval_metric(Y_test, test_preds, "R2")[0])
print("Train R2 : %.2f"%eval_metric(Y_train, train_preds, "R2")[0])
cv_results = pd.DataFrame(search_results["cv_results"])

cv_results.head()
3.4 Important Parameters of CatBoost Model 
NOTE: Please feel free to skip this section if you are in hurry. It is a theoretical section listing parameters of "CatBoost()" constructor. You can refer to them later as you need to tweak model.
Below we have listed down important parameters of gradient boosting algorithm which we can pass to CatBoost constructor in a dictionary when creating an estimator. These parameters will be available in CatBoostRegressor and CatBoostClassifier constructor as well.
- loss_function - It accepts string specifying metric used during training. The gradient boosting algorithm will try to minimize/maximize loss function output depending on the situation. Below we have given some commonly used loss functions.
- RMSE
- MAE
- Logloss
- CrossEntropy
- MultiClass
- MultiClassOneVsAll
- Other Available Loss Functions
- custom_metric - It’s the same as the above parameter and the output of the function specified here will be printed during training. We can specify a single metric or even a list of metrics.
- eval_metric - It accepts string specifying metric to evaluate on evaluation set given during training. It has the same options as that of loss_function.
- iterations - It accepts integers specifying the number of trees to train. The default is 1000.
- learning_rate - It specifies the learning rate during the training process. The default is 0.03.
- l2_leaf_reg - It accepts float specifying coefficient of L2 regularization of a loss function. The default value is 3.
- bootstrap_type - It accepts string specifying bootstrap type. Below is a list of possible values.
- Bayesian
- Bernoulli
- MVS
- Poisson - Only works when training on GPU
- No
- class_names - It accepts a list of string specifying class names for classification tasks.
- classes_count - It accepts integer specifying the number of classes in target for multi-class classification problem.
- depth/max_depth - It accepts integer specifying maximum allowed tree depth in an ensemble. The default is 6.
- min_data_in_leaf - It accepts an integer specifying a minimum number of training samples per leaf of a tree. The default is 1.
- max_leaves - It accepts an integer specifying the minimum number of leaves in a tree. The default is 31.
- leaf_estimation_method - It accepts the string specifying method used to calculate values in leaves. Below is a list of possible options.
- Newton
- Gradient
- Exact
- monotone_constraints - It accepts list of integers of length n_features. Each entry in the list has a value of either 1,0 or -1 specifying increasing, none, or decreasing monotone relation of a feature with the target. We can even give a list of strings or a dictionary of mapping from feature names to relation types.
- early_stopping_rounds - It accepts an integer that instructs the algorithm to stop training if the last evaluation set in the list has not improved for that many rounds.
- thread_count - It accepts integer specifying the number of threads to use during training. The default is -1 which means to use all cores on the system.
- used_ram_limit - It accepts string specifying the size of RAM to use when training. It accepts values in KB, MB, and GB.
- gpu_ram_part - It accepts float between 0-1 specifying how much GPU ram to use. The default is 0.95 which means 95% of RAM.
- task_type - It accepts one of the below options specifying whether to run the task on CPU or GPU.
- CPU
- GPU
- devices - It accepts string specifying IDs of GPUs to use for training. Below are possible options
- Single GPU - [id1] - It'll use GPU with id1 for training.
- List of GPUs - [id1]:[id3]:[id5] - It'll use GPU with id1, id3 and id5 for training.
- Range of GPUs - [id1]:[id3] - It'll use GPU with id1, id2 and id3 for taining.
- train_dir - It accepts string specifying where to store info generated during training. The default is catboost_info.
Please make a note that the above-mentioned list is not all possible parameters available in CatBoost. The above list includes important parameters which are generally tuned for good performance. Below we have given a list of all possible parameters available.
3.5 Important Parameters of "Catboost.fit()" Methods 
NOTE: Please feel free to skip this section if you are in hurry. It is a theoretical section listing parameters of "CatBoost()" constructor. You can refer to them later as you need to tweak model.
- cat_features - It accepts a list of integer specifying indices of data that has categorical features.
- text_features - - It accepts a list of integer specifying indices of data that has text features.
- embedding_features - - It accepts a list of integer specifying indices of data that has embedding features.
- eval_set - It accepts a list of below options as input to be used as an evaluation set.
- catboost.Pool
- pandas dataframe
- numpy tuple of features and target labels.
- early_stopping_rounds - It accepts an integer that instructs the algorithm to stop training if the last evaluation set in the list has not improved for that many rounds.
- plot - It accepts boolean value specifying whether to generate a plot of training results.
- save_snapshot - It accepts boolean value specifying whether to store a snapshot of training at a specified interval so that interrupted training can be resumed later from that point rather than from the beginning.
- snapshot_file - It accepts string specifying file name where to stop snapshots during training.
- snapshot_interval - It accepts integer specifying interval in seconds at which snapshots are saved.
4. CatBoost: Regression ("Pool" Data Structure to Represent Datasets) 
As a part of this section, we are explaining how we can use the catboost internal data structure named Pool for maintaining data. We have even explained how we can create a CatBoost estimator using the train() method of the catboost library. Please make a note that catboost.train() has almost all parameters same as that of CatBoost.fit() method.
The Pool is an internal data structure of catboost that wraps our data and target values. It can make training faster.
4.1 Important Parameters Of "Pool()" Constructor
Below we have given important parameters of the Pool constructor.
- data - It accepts numpy array, pandas dataframe, or list which has features values.
- label - It accepts numpy array, pandas dataframe, or list which has target labels.
- cat_features - It accepts a list of integer specifying indices of data that has categorical features.
- text_features -It accepts a list of integer specifying indices of data that has text features.
Below we have explained how we can use the Pool data structure with the train() method to generate the CatBoost estimator.
from catboost import Pool

X_train, X_test, Y_train, Y_test = train_test_split(boston.data, boston.target, train_size=0.9, random_state=123)

train_data = Pool(X_train, Y_train)
test_data = Pool(X_test, Y_test)

booster = catboost.train(pool=train_data,params={'iterations':100,
                                                 'verbose':10,
                                                 'loss_function':'RMSE',
                                                 })

print()
print(booster)

booster.set_feature_names(boston.feature_names)

test_preds = booster.predict(test_data)
train_preds = booster.predict(train_data)

print("\nTest  R2 : %.2f"%eval_metric(Y_test, test_preds, "R2")[0])
print("Train R2 : %.2f"%eval_metric(Y_train, train_preds, "R2")[0])
Below we have given another example where we have explained how we can give an evaluation set that will be evaluated during training.
from catboost import Pool
from catboost.utils import eval_metric

X_train, X_test, Y_train, Y_test = train_test_split(boston.data, boston.target, train_size=0.9, random_state=123)

train_data = Pool(X_train, Y_train)
test_data = Pool(X_test, Y_test)

booster = CatBoost({'verbose':10, 'iterations':100})
booster.fit(train_data, eval_set=(test_data))
booster.set_feature_names(boston.feature_names)

test_preds = booster.predict(test_data)
train_preds = booster.predict(train_data)

print("\nTest  R2 : %.2f"%eval_metric(Y_test, test_preds, "R2")[0])
print("Train R2 : %.2f"%eval_metric(Y_train, train_preds, "R2")[0])
Catboost has a method named to_regressor() which takes CatBoost instance and converts it to CatBoostRegressor instance.
catboost.to_regressor(booster)
5. CatBoost: Binary Classification Example 
As a part of this section, we have explained how we can use CatBoost for binary classification problems. We have divided breast cancer data into train and test sets. We have created the CatBoost instance with the LogLoss loss function and then trained the model on train data. We have then evaluated it on test data as well as printing its accuracy.
Please make a note that the predict() method has a parameter named prediction_type which accepts the below-mentioned value to generate different predictions.
- RawFormulaVal - It generates raw output from a gradient boosting algorithm.
- Class - It returns class number for classification problems.
- Probability - It returns probability for classification problem.
X_train, X_test, Y_train, Y_test = train_test_split(breast_cancer.data, breast_cancer.target, train_size=0.9,
                                                    stratify=breast_cancer.target,
                                                    random_state=123)

booster = CatBoost(params={'iterations':100, 'verbose':10, 'loss_function':'Logloss'})

booster.fit(X_train, Y_train, eval_set=(X_test, Y_test))
booster.set_feature_names(breast_cancer.feature_names)

test_preds = booster.predict(X_test, prediction_type="Class")
train_preds = booster.predict(X_train, prediction_type="Class")

from catboost.utils import eval_metric

print("\nTest  Accuracy : %.2f"%eval_metric(Y_test, test_preds, "Accuracy")[0])
print("Train Accuracy : %.2f"%eval_metric(Y_train, train_preds, "Accuracy")[0])
Below we have explained how we can generate probabilities with the predict() function.
booster.predict(X_test, prediction_type="Probability")[:5]
Catboost has method named to_classifier() which takes CatBoost instance and converts it to CatBoostClassifier instance.
catboost.to_classifier(booster)
6. CatBoost: Multi-Class Classification Example 
NOTE: Please feel free to skip this section if you are in hurry and have already understood how to use catboost for classification tasks using our previous "binary classification" example.
As a part of this section, we have explained how we can use CatBoost for multi-class classification problems. We have used the wine dataset for this section as it has three classes to predict.
X_train, X_test, Y_train, Y_test = train_test_split(wine.data, wine.target, train_size=0.9,
                                                    stratify=wine.target,
                                                    random_state=123)

booster = CatBoost(params={'iterations':100, 'verbose':10, 'loss_function':'MultiClass', 'classes_count':3})

booster.fit(X_train, Y_train, eval_set=(X_test, Y_test))
booster.set_feature_names(wine.feature_names)

test_preds = booster.predict(X_test, prediction_type="Class").flatten()
train_preds = booster.predict(X_train, prediction_type="Class").flatten()

from catboost.utils import eval_metric

print("\nTest  Accuracy : %.2f"%eval_metric(Y_test, test_preds, "Accuracy")[0])
print("Train Accuracy : %.2f"%eval_metric(Y_train, train_preds, "Accuracy")[0])
booster.predict(X_test, prediction_type="Probability")[:5]
7. CatBoostRegressor (Scikit-Learn Like API) 
The catboost provides an estimator named CatBoostRegressor which can be used directly for regression problems. It accepts the same parameters that were given to CatBoost as a dictionary directly. Below we have explained how we can use it with a simple example using the Boston dataset.
from catboost import CatBoostRegressor

X_train, X_test, Y_train, Y_test = train_test_split(boston.data, boston.target, train_size=0.9, random_state=123)

booster = CatBoostRegressor(iterations=100, verbose=10)

booster.fit(X_train, Y_train, eval_set=(X_test, Y_test))
booster.set_feature_names(boston.feature_names)

test_preds = booster.predict(X_test)
train_preds = booster.predict(X_train)

from catboost.utils import eval_metric

print("\nTest  R2 : %.2f"%booster.score(X_test, Y_test))
print("Train R2 : %.2f"%booster.score(X_train, Y_train))
Important Attributes & Methods of "CatBoostRegressor"
It has the same attributes and methods which are available with the CatBoost estimator.
Hyperparameters Tunning: Grid Search
NOTE: Please feel free to skip this section if you are in hurry and have already understood how to perform a grid search with Catboost from earlier examples.
The CatBoostRegressor also has a grid_search() method which can be used to perform grid search with it. We have explained it below with a simple example.
booster = CatBoostRegressor()

params = {
            'iterations':[10,50],
            'learning_rate':[0.01, 0.1],
            'bootstrap_type':['Bayesian', 'No']
}

search_results = booster.grid_search(params, X_train, Y_train, cv=5, )

print("\nBest Params : ", search_results['params'])
Hyperparameters Tunning: Randomized Search
NOTE: Please feel free to skip this section if you are in hurry and have already understood how to perform a randomized search with Catboost from earlier examples.
The CatBoostRegressor also has a randomized_search() method which can be used to perform a randomized search with it. We have explained it below with a simple example.
booster = CatBoostRegressor()

params = {
            'iterations':[5,50,],
            'learning_rate':[0.01, 0.1],
            'bootstrap_type':['Bayesian', 'Bernoulli', 'MVS']
}

search_results = booster.randomized_search(params, X_train, Y_train, cv=5, n_iter=8)

print("\nBest Params : ", search_results['params'])
8. CatBoostClassifier (Scikit-Learn Like API) 
The catboost provides an estimator named CatBoostClassifier which can be used directly for regression problems. It accepts the same parameters that were given to CatBoost as a dictionary directly.
8.1 Binary Classification Example
Below we have explained how we can perform binary classification using CatBoostClassifier.
from catboost import CatBoostClassifier

X_train, X_test, Y_train, Y_test = train_test_split(breast_cancer.data, breast_cancer.target, train_size=0.9,
                                                    stratify=breast_cancer.target,
                                                    random_state=123)


booster = CatBoostClassifier(iterations=100, verbose=10)

booster.fit(X_train, Y_train, eval_set=(X_test, Y_test))
booster.set_feature_names(breast_cancer.feature_names)

test_preds = booster.predict(X_test)
train_preds = booster.predict(X_train)

print("\nTest  Accuracy : %.2f"%booster.score(X_test, Y_test))
print("Train Accuracy : %.2f"%booster.score(X_train, Y_train))
The CatBoostClassifier provides a method named predict_proba() which can be used to generate output as a list of probabilities.
booster.predict_proba(X_test)[:5]
booster.predict_log_proba(X_test)[:5]
Important Attributes & Methods of "CatBoostClassifier"
It has the same attributes and methods which are available with the CatBoost estimator.
Hyperparameters Tunning: Grid Search & Randomized Search
The CatBoostClassifier also has grid_search() and randomized_search() methods which work exactly the same way as CatBoost and CatBoostRegresor hence we have not repeated the code again to explain it.
8.2 Multi-Class Classification Example
NOTE: Please feel free to skip this section if you are in hurry and have already understood how to use "CatBoostClassifier" for classification tasks using our previous "binary classification" example.
Below we have given a simple example which explains how CatBoostClassifier can be used for multi-class classification problems.
from catboost import CatBoostClassifier

X_train, X_test, Y_train, Y_test = train_test_split(wine.data, wine.target, train_size=0.9,
                                                    stratify=wine.target,
                                                    random_state=123)


booster = CatBoostClassifier(iterations=100, verbose=10)

booster.fit(X_train, Y_train, eval_set=(X_test, Y_test))
booster.set_feature_names(wine.feature_names)

test_preds = booster.predict(X_test)
train_preds = booster.predict(X_train)

print("\nTest  Accuracy : %.2f"%booster.score(X_test, Y_test))
print("Train Accuracy : %.2f"%booster.score(X_train, Y_train))
booster.predict_proba(X_test)[:5]
9. Cross Validation Example 
The catboost provides a method named cv() which can be used to perform cross-validation on data. Below we have explained with few examples of how we can perform cross-validation in catboost.
from catboost import cv, Pool

data = Pool(boston.data, boston.target)

cv(data, params={'iterations':10, 'loss_function':'RMSE'}, nfold=5)
from catboost import cv, Pool

data = Pool(breast_cancer.data, breast_cancer.target)

cv(data, params={'iterations':10, 'loss_function':'CrossEntropy'}, nfold=5)
10. Saving and Loading Model 
Each catboost estimator(CatBoost, CatBoostClassifier & CatBoostRegressor) provides method named save_model() and load_model() which can be used to save trained model and reload saved model.
Below we have explained with a simple example of how we can save and load the catboost model. We have even evaluated the loaded model again to verify.
from catboost import Pool, CatBoost
from catboost.utils import eval_metric

X_train, X_test, Y_train, Y_test = train_test_split(boston.data, boston.target, train_size=0.9, random_state=123)

booster = CatBoost({'verbose':10, 'iterations':100})
booster.fit(X_train,Y_train, eval_set=(X_test,Y_test))
booster.set_feature_names(boston.feature_names)

test_preds = booster.predict(X_test)
train_preds = booster.predict(X_train)

print("\nTest  R2 : %.2f"%eval_metric(Y_test, test_preds, "R2")[0])
print("Train R2 : %.2f"%eval_metric(Y_train, train_preds, "R2")[0])
How to Save "CatBoost" Model using "save_model()" Method?
booster.save_model("catboost_regressor.model")
How to Load "CatBoost" Model using "load_model()" Method?
loaded_booster = CatBoost()

loaded_booster.load_model("catboost_regressor.model")
test_preds = loaded_booster.predict(X_test)
train_preds = loaded_booster.predict(X_train)

print("\nTest  R2 : %.2f"%eval_metric(Y_test, test_preds, "R2")[0])
print("Train R2 : %.2f"%eval_metric(Y_train, train_preds, "R2")[0])
11. Plotting Functionalities in CatBoost 
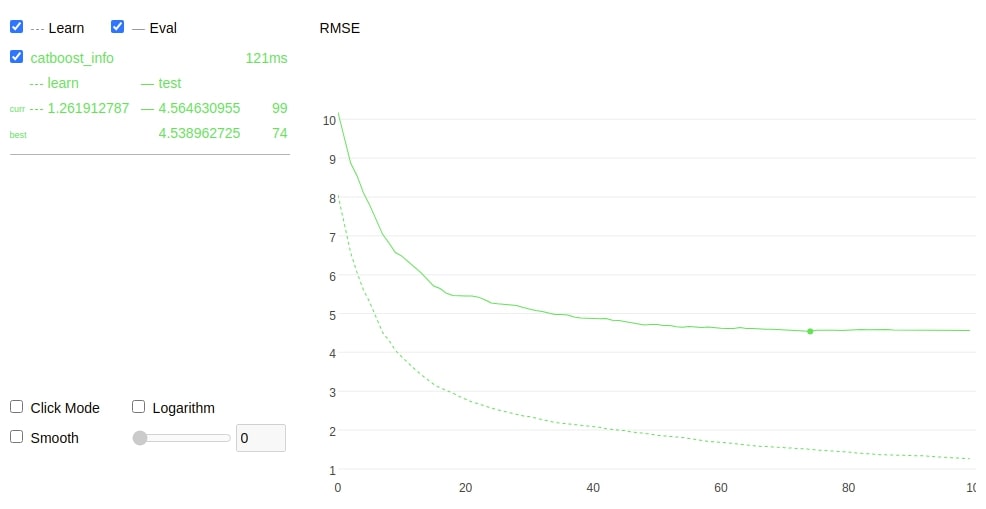
11.1 Visualize Training Loss and Metric Values
Catboost provides us with a few simple plotting functionalities which can be useful to analyze model performance. The catboost estimator's fit() method has a parameter named plot which is set to True will plot the result of the training process. We have explained below how we can plot the training process.
The grid_search() and randomized_search() methods of the estimator’s also had plot parameter which if set to True will generate a plot for them.
from catboost import Pool, CatBoost
from catboost.utils import eval_metric

X_train, X_test, Y_train, Y_test = train_test_split(boston.data, boston.target, train_size=0.9, random_state=123)

booster = CatBoost({'verbose':0, 'iterations':100})
booster.fit(X_train,Y_train, eval_set=(X_test,Y_test), plot=True);
booster.set_feature_names(boston.feature_names)

#test_preds = booster.predict(X_test)
#train_preds = booster.predict(X_train)

#print("\nTest  R2 : %.2f"%eval_metric(Y_test, test_preds, "R2")[0])
#print("Train R2 : %.2f"%eval_metric(Y_train, train_preds, "R2")[0])
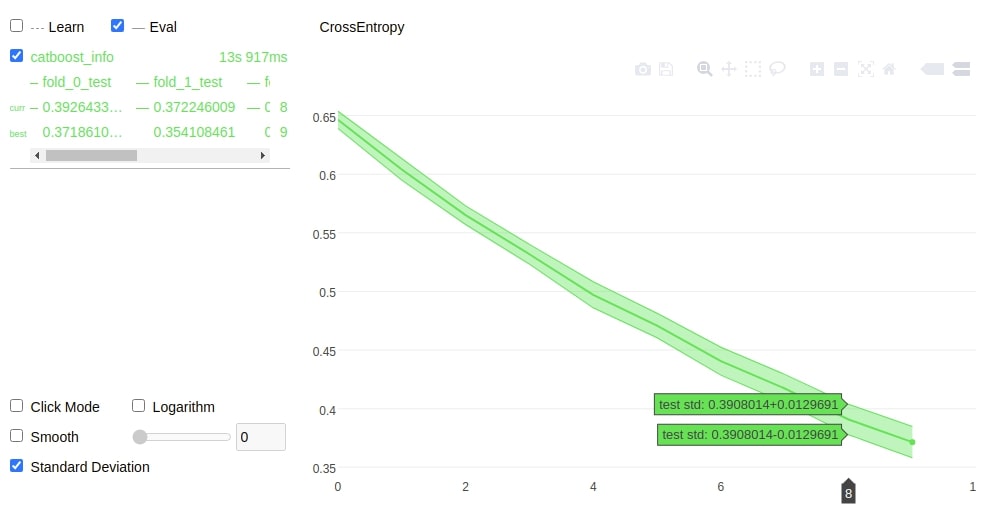
The cv() method of catboost also has a plot parameter which if set to True will generate a plot for cross-validation. We have explained the usage of the same below.
from catboost import cv

data = Pool(breast_cancer.data, breast_cancer.target)

cv(data, params={'iterations':10, 'loss_function':'CrossEntropy'}, nfold=5, plot=True, verbose=False);
11.2 Visualize Individual Tree of Ensemble using "plot_tree()"
Each catboost estimators have a method named plot_tree() which accepts integer and plots tree with that index from an ensemble of trees. Below we have plotted the 2nd tree. The output of the method is graphviz graph which we have saved.
out = booster.plot_tree(1)

out.render('tree', format="png")

out

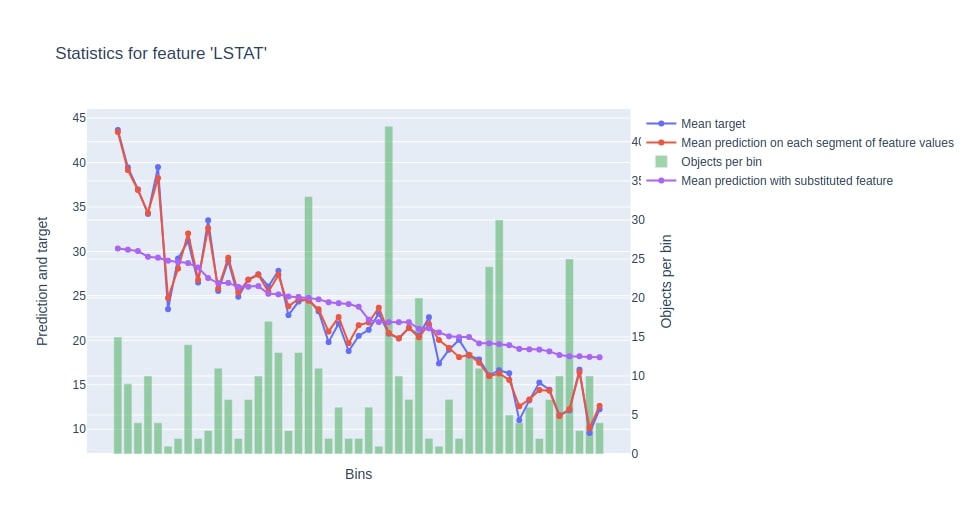
11.3 Visualize Important Statistics of Data Features using "calc_feature_statistics()"
The calc_feature_statistics() method estimator takes as input data, target labels and feature names. It then generated a chart showing statistics of the feature using a trained model, dataset, and target labels.
Below we have generated feature statistics for the LSTAT feature.
booster.calc_feature_statistics(X_train, Y_train, feature="LSTAT");
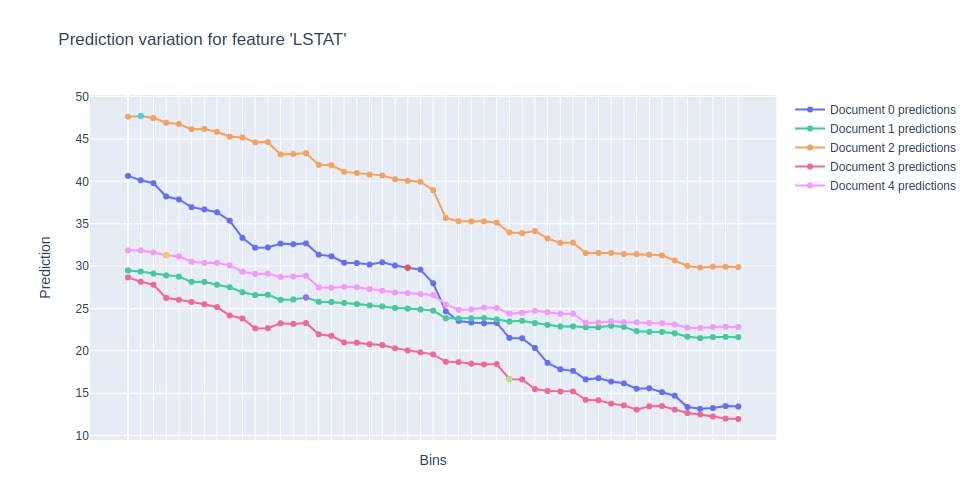
11.4 Visualize Individual Predictions using "plot_predictions()"
The plot_predictions() function takes as input dataset and list of features names/feature indices. It then sequentially vary the value of given features and calculate predictions.
booster.plot_predictions(X_test[:5], features_to_change=["LSTAT"]);
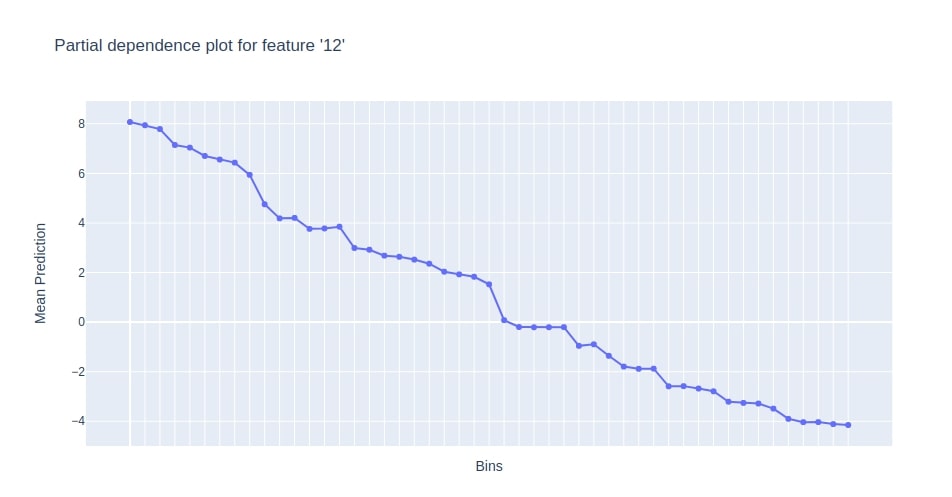
11.5 Partial Dependence Plot of Features using "plot_partial_dependence()"
It generates a partial dependence plot of the feature based on given data.
booster.plot_partial_dependence(Pool(X_train, Y_train)
                                , features=["LSTAT"]);
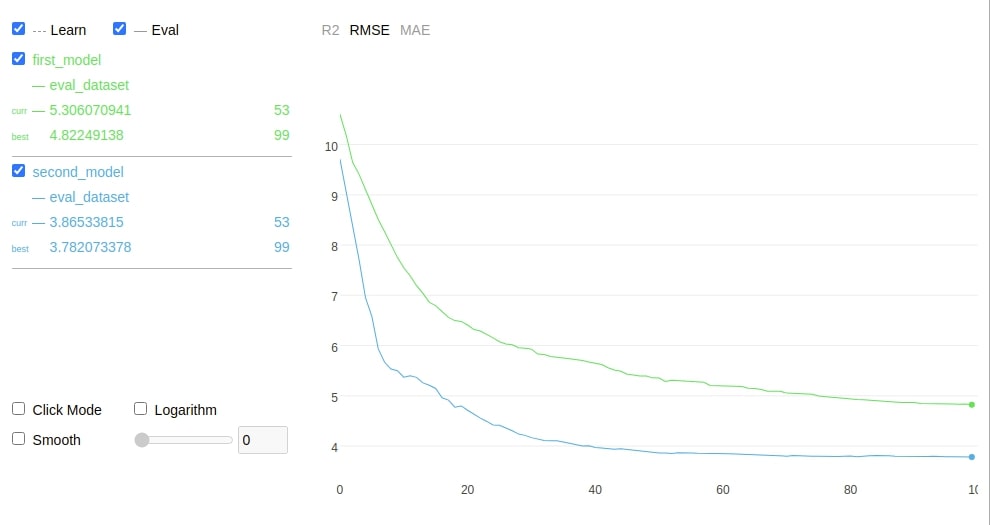
11.6 Visualization to Compare Performance Of Different Models using "compare()" Method
The catboost estimators have a method named compare() which takes as input another estimator and a list of metrics to compare the performance of both models on a specified list of metrics. Below we have explained how we can compare the performance of two different catboost estimators using the compare() method. We have used metrics R2, RMSE, and MAE for it.
from catboost import Pool, CatBoost
from catboost.utils import eval_metric

X_train, X_test, Y_train, Y_test = train_test_split(boston.data, boston.target, train_size=0.9, random_state=123)

booster1 = CatBoost({'verbose':0, 'iterations':100, 'learning_rate':0.1, 'bootstrap_type':'Bayesian'})
booster1.fit(X_train,Y_train, eval_set=(X_test,Y_test))
booster1.set_feature_names(boston.feature_names)

test_preds = booster1.predict(X_test)
train_preds = booster1.predict(X_train)

print("Model-1")
print("Test  R2 : %.2f"%eval_metric(Y_test, test_preds, "R2")[0])
print("Train R2 : %.2f"%eval_metric(Y_train, train_preds, "R2")[0])

booster2 = CatBoost({'verbose':0, 'iterations':100, 'learning_rate':0.3, 'bootstrap_type':'No'})
booster2.fit(X_train,Y_train, eval_set=(X_test,Y_test))
booster2.set_feature_names(boston.feature_names)

test_preds = booster2.predict(X_test)
train_preds = booster2.predict(X_train)

print("\nModel-2")
print("Test  R2 : %.2f"%eval_metric(Y_test, test_preds, "R2")[0])
print("Train R2 : %.2f"%eval_metric(Y_train, train_preds, "R2")[0])
How to Compare Performance of Different CatBoost Models?
booster1.compare(booster2, data=Pool(X_test,Y_test), metrics=["R2", "RMSE", "MAE"])
12. Recovering Interrupted Training using Snapshots 
Catboost provides support for saving the training process and recovering the training process if it was interrupted. It provides us with parameters named save_snapshot, snapshot_file, and snapshot_interval which save training results at particular intervals. We can then rerun training from the interrupted part rather than from the beginning using these parameters.
Below we are training CatBoostRegressor for 15000 iterations so that it takes time to complete. We are then interrupting training after a few seconds. We have set the save_snapshot parameter of the fit() method to True so that it takes a snapshot during training. The snapshot_interval is set to 1 so that snapshots are taken every 1 minute. The snapshots are saved in a file named catboost_snapshots.temp.
from catboost import Pool
from catboost.utils import eval_metric
from catboost import CatBoost, CatBoostClassifier, CatBoostRegressor
from sklearn.model_selection import train_test_split

X_train, X_test, Y_train, Y_test = train_test_split(boston.data, boston.target, train_size=0.9, random_state=123)

booster = CatBoostRegressor(verbose=1000, iterations=15000)

booster.fit(X_train, Y_train,save_snapshot=True, snapshot_file="catboost_snapshots.temp",snapshot_interval=1)
booster.set_feature_names(boston.feature_names)

test_preds = booster.predict(X_test)
train_preds = booster.predict(X_train)

print("\nTest  R2 : %.2f"%eval_metric(Y_test, test_preds, "R2")[0])
print("Train R2 : %.2f"%eval_metric(Y_train, train_preds, "R2")[0])
Below we are again starting the training process after interruption and we can notice that it has started from where the last snapshot was taken.
X_train, X_test, Y_train, Y_test = train_test_split(boston.data, boston.target, train_size=0.9, random_state=123)

booster = CatBoostRegressor(verbose=1000, iterations=15000)

booster.fit(X_train, Y_train, save_snapshot=True, snapshot_file="catboost_snapshots.temp",snapshot_interval=1)
booster.set_feature_names(boston.feature_names)

test_preds = booster.predict(X_test)
train_preds = booster.predict(X_train)

print("\nTest  R2 : %.2f"%eval_metric(Y_test, test_preds, "R2")[0])
print("Train R2 : %.2f"%eval_metric(Y_train, train_preds, "R2")[0])
13. Early Stop Training to Avoid Overfitting 
The catboost provides a parameter named early_stopping_rounds in the fit() method of all estimators which can be set to some integer. The training process will stop if the training loss function output is not improving constantly for a specified number of rounds (specified using the early_stopping_rounds parameter).
Below we have explained with a simple example of how we can use early_stopping_rounds. We can notice that training stops when it does improve loss for 5 consecutive rounds.
from catboost import Pool
from catboost.utils import eval_metric

X_train, X_test, Y_train, Y_test = train_test_split(boston.data, boston.target, train_size=0.9, random_state=123)

booster = CatBoost({'verbose':10, 'iterations':100})
booster.fit(X_train, Y_train, eval_set=(test_data), early_stopping_rounds=5)
booster.set_feature_names(boston.feature_names)

test_preds = booster.predict(X_test)
train_preds = booster.predict(X_train)

print("\nTest  R2 : %.2f"%eval_metric(Y_test, test_preds, "R2")[0])
print("Train R2 : %.2f"%eval_metric(Y_train, train_preds, "R2")[0])

print("\nNumber of Trees in Ensemble : ", booster.tree_count_)
14. Monotonic Constraints 
The monotonic constraints let us specify the increasing, decreasing, or no monotone relation of a feature with a target. We can specify a monotone value of 1,0 or -1 for each feature to show the increasing, none, and decreasing relation of the feature with the target by setting the monotone_constraints parameter. Below we have explained the usage of monotonic constraints for regression tasks using the Boston dataset.
Please make a note that the below estimator is not giving a good R2 score because we have randomly set monotonic constraints values just for explanation purposes.
from catboost import Pool
from catboost.utils import eval_metric

X_train, X_test, Y_train, Y_test = train_test_split(boston.data, boston.target, train_size=0.9, random_state=123)

booster = CatBoost({'verbose':10, 'iterations':100,
                    'monotone_constraints':[1,0,0,-1,1,-1,0,-1,0,0, -1, 0,1]})
booster.fit(X_train, Y_train, eval_set=(test_data))
booster.set_feature_names(boston.feature_names)

test_preds = booster.predict(X_test)
train_preds = booster.predict(X_train)

print("\nTest  R2 : %.2f"%eval_metric(Y_test, test_preds, "R2")[0])
print("Train R2 : %.2f"%eval_metric(Y_train, train_preds, "R2")[0])

print("\nNumber of Trees in Ensemble : ", booster.tree_count_)
15. Custom Evaluation Metric 
As a part of this section, we'll explain how we can use a custom evaluation metric with catboost. We can design a class that can be used as a custom evaluation metric but it should have below mentioned three methods included in it.
- is_max_optimal() - This method returns True if we want to maximize metric else False.
- evaluate() - This method returns an error and total weight for a list of prediction and target labels. The logic of calculating error for a list of values should be included here.
- get_final_error() - This method returns actual metric value based on total error and total weight. The logic of calculating the final error based on weights should be included here.
Below we have created a simple mean absolute error metric. We have then given the same metric to the eval_metric method of CatBoostRegressor. We can notice from the training results that it is printing mean absolute error at every 10 iterations for the evaluation dataset which is a test set in our case.
class MeanAbsoluteError(object):
    def is_max_optimal(self):
        ## Return True if We want to Maximize metric else false if want to minimize
        ## We have passed False because we want to decrease metric
        return False

    def evaluate(self, approxes, target, weight):
        error = 0
        weight_sum = 0

        for i in range(len(approxes[0])):
            w = 1.0 if weight is None else weight[i]
            error += w* (target[i] - approxes[0][i])
            weight_sum += w

        return error, 1.0 if weight is None else weight_sum

    def get_final_error(self, error, weight):
        # Returns final value of metric based on error and weight
        return error / weight
from catboost.utils import eval_metric
from catboost import CatBoostRegressor
from sklearn.model_selection import train_test_split

X_train, X_test, Y_train, Y_test = train_test_split(boston.data, boston.target, train_size=0.9, random_state=123)

booster = CatBoostRegressor(verbose=10, iterations=100,
                            eval_metric=MeanAbsoluteError(),
                            )
booster.fit(X_train, Y_train, eval_set=[(X_test, Y_test)])

booster.set_feature_names(boston.feature_names)

test_preds = booster.predict(X_test)
train_preds = booster.predict(X_train)

print("\nTest  R2 : %.2f"%eval_metric(Y_test, test_preds, "R2")[0])
print("Train R2 : %.2f"%eval_metric(Y_train, train_preds, "R2")[0])
16. Custom Objective/Loss Function 
As a part of this section, we'll explain how we can use the custom loss function with catboost. We can create a class that can be used as a custom loss function but it should have one method named calc_ders_range(). This method takes as an input list of predictions, actual target labels, and weights. It then returns a list of tuples where the first value in the tuple is the first derivative of the loss function and the second value is the second derivative of a loss function. The list of tuple must have the same length as the list of predictions and target labels passed to it.
We can then pass this class to the loss_function parameter of estimators. Below we have created a simple mean squared error loss function and explained usage of it with a simple example in the next cell.
class MeanSquaredErrorLoss(object):
    def calc_ders_range(self, approxes, targets, weights):
        # This function should return a list of pairs (der1, der2), where
        # der1 is the first derivative of the loss function with respect
        # to the predicted value, and der2 is the second derivative.
        result = []
        for index in range(len(targets)):
            der1 = 2*(targets[index] - approxes[index]) ## First Derivative of Loss Function
            der2 = -1                                   ## Second Derivative of Loss Function

            result.append((der1, der2))

        return result
from catboost.utils import eval_metric
from catboost import CatBoostRegressor
from sklearn.model_selection import train_test_split

X_train, X_test, Y_train, Y_test = train_test_split(boston.data, boston.target, train_size=0.9, random_state=123)

booster = CatBoostRegressor(verbose=10, iterations=100,
                            loss_function=MeanSquaredErrorLoss(),
                            eval_metric="R2"
                            )
booster.fit(X_train, Y_train, eval_set=[(X_test, Y_test)])
booster.set_feature_names(boston.feature_names)

test_preds = booster.predict(X_test)
train_preds = booster.predict(X_train)

print("\nTest  R2 : %.2f"%eval_metric(Y_test, test_preds, "R2")[0])
print("Train R2 : %.2f"%eval_metric(Y_train, train_preds, "R2")[0])
17. How to Use CatBoost with Text Data? 
NOTE: Please feel free to skip this section if you are working with tabular data. You can refer it later when you want to learn about how to use Catboost for tasks involving text datasets.
As a part of this section, we'll explain with a simple example of how we can handle text data with catboost. We'll start by loading the spam/ham dataset available from the UCI website. We have included the code below to download it. We have then loaded the dataset as a list of text and labels.
!wget https://archive.ics.uci.edu/ml/machine-learning-databases/00228/smsspamcollection.zip
!unzip smsspamcollection.zip
import collections

with open('SMSSpamCollection') as f:
    data = [line.strip().split('\t') for line in f.readlines()]

y, text = zip(*data)

collections.Counter(y)
Example 1
The simplest way to work with text data is to let catboost handle the column with text data by itself. Catboost will tokenize data and convert it to a float array by itself. We'll be using catboost's internal Pool data structure for this purpose. The Pool data structure has an argument named text_features which accepts a list of indices in data that holds text data. As our dataset only has text data, we have given 0 in that list. We have then normally created the CatBoostClassifier instance and trained it on train data. We have later evaluated it on test data to check accuracy as well which is very impressive.
The catboost estimators have a parameter named text_processing which has some default JSON values which are responsible for handling text data. The default value is available at this link.
from catboost import CatBoostClassifier, Pool
from sklearn.model_selection import train_test_split

X_train, X_test, Y_train, Y_test = train_test_split(pd.DataFrame(text), y, train_size=0.9, stratify=y, random_state=123)

train_data = Pool(X_train, Y_train, text_features=[0])
test_data = Pool(X_test, Y_test, text_features=[0])

booster = CatBoostClassifier(iterations=10, learning_rate=0.03, eval_metric='Accuracy')

booster.fit(train_data, eval_set=test_data)

print("\nTest  Accuracy : %.2f"%booster.score(train_data))
print("Train Accuracy : %.2f"%booster.score(test_data))
Example 2
As a part of our second example, we have explained how we can specify the value for the text_processing parameter if we want to impose a different way of handling text data.
from catboost import CatBoostClassifier, Pool
from sklearn.model_selection import train_test_split

X_train, X_test, Y_train, Y_test = train_test_split(pd.DataFrame(text), y, train_size=0.9, stratify=y, random_state=123)

train_data = Pool(X_train, Y_train, text_features=[0])
test_data = Pool(X_test, Y_test, text_features=[0])

booster = CatBoostClassifier(iterations=10, learning_rate=0.03, eval_metric='Accuracy',
                             text_processing=['NaiveBayes+Word|BoW+Word:min_token_occurrence=5'])

booster.fit(train_data, eval_set=test_data)

print("\nTest  Accuracy : %.2f"%booster.score(train_data))
print("Train Accuracy : %.2f"%booster.score(test_data))
Example 3
Our third example for text data gives us another example of handling text data with the text_processing parameter.
from catboost import CatBoostClassifier, Pool
from sklearn.model_selection import train_test_split

X_train, X_test, Y_train, Y_test = train_test_split(pd.DataFrame(text), y, train_size=0.9, stratify=y, random_state=123)

train_data = Pool(X_train, Y_train, text_features=[0])
test_data = Pool(X_test, Y_test, text_features=[0])

booster = CatBoostClassifier(iterations=10, learning_rate=0.03, eval_metric='Accuracy',
                             text_processing=['NaiveBayes+Word,BiGram|BoW:token_level_type=Word,top_tokens_count=1000+Word,BiGram'])

booster.fit(train_data, eval_set=test_data)

print("\nTest  Accuracy : %.2f"%booster.score(train_data))
print("Train Accuracy : %.2f"%booster.score(test_data))
Example 4
As a part of our fourth example for handling text data, we have used the TF-IDF vectorizer available from scikit-learn to transform our text data to float. All other parts of the code are almost the same as previous examples with the only difference that we are using TF-IDF transformed arrays for training and evaluation now.
If you are interested in learning about feature extraction from text data using scikit-learn then please feel free to check our tutorial on the same to get an in-depth idea about it.
from sklearn.feature_extraction.text import TfidfVectorizer, CountVectorizer

X_train, X_test, Y_train, Y_test = train_test_split(text, y, train_size=0.50, stratify=y, random_state=123)

vectorizer = TfidfVectorizer(max_features=500)

X_train_vect = vectorizer.fit_transform(X_train)
X_test_vect = vectorizer.transform(X_test)

train_data = Pool(X_train_vect.toarray(), Y_train) ## toarray() is added to prevent catboost from failing (to avoid sparse array error)
test_data = Pool(X_test_vect.toarray(), Y_test) ## toarray() is added to prevent catboost from failing (to avoid sparse array error)

booster = CatBoostClassifier(iterations=10)

booster.fit(train_data, eval_set=test_data)

print("\nTest  Accuracy : %.2f"%booster.score(train_data))
print("Train Accuracy : %.2f"%booster.score(test_data))
18. How to Train CatBoost Model on GPU? 
Catboost let us run the training process on GPU. It lets us run the training process on a single GPU or even on multiple GPUs in parallel.
In order to run training on GPU, we need to set the task_type parameter of estimators to GPU. We can provide the devices parameter with a list of the below-mentioned values to run the training process on single/multiple GPUs.
- Single GPU - [id1] - e.g : "1" - It'll use GPU with id 1 for training.
- List of GPUs - [id1]:[id3]:[id5] - e.g : "1:3:5" - It'll use GPUs with id 1, 3 and 5 for training.
- Range of GPUs - [id1]:[id3] - e.g : "1-3" - It'll use GPUs with id 1, 2 and 3 for training.
We can get the count of GPUs present on the system using the get_gpu_device_count() method of the utils module.
from catboost import utils

gpu_cnt = utils.get_gpu_device_count()

print("Number of GPU Count : ",gpu_cnt)
Below we have explained with simple examples of how we can use GPU for the training process.
from catboost import Pool
from catboost.utils import eval_metric

X_train, X_test, Y_train, Y_test = train_test_split(boston.data, boston.target, train_size=0.9, random_state=123)

train_data = Pool(X_train, Y_train)
test_data = Pool(X_test, Y_test)

booster = CatBoost({'verbose':10, 'iterations':100, 'task_type':"GPU", 'devices':'0'})
booster.fit(train_data)
booster.set_feature_names(boston.feature_names)

test_preds = booster.predict(X_test)
train_preds = booster.predict(X_train)

print("\nTest  R2 : %.2f"%eval_metric(Y_test, test_preds, "R2")[0])
print("Train R2 : %.2f"%eval_metric(Y_train, train_preds, "R2")[0])
from catboost import CatBoostRegressor

X_train, X_test, Y_train, Y_test = train_test_split(boston.data, boston.target, train_size=0.9, random_state=123)

booster = CatBoostRegressor(iterations=100, verbose=10, task_type="GPU", devices="0")

booster.fit(X_train, Y_train, eval_set=(X_test, Y_test))
booster.set_feature_names(boston.feature_names)

test_preds = booster.predict(X_test)
train_preds = booster.predict(X_train)

print("\nTest  R2 : %.2f"%booster.score(X_test, Y_test))
print("Train R2 : %.2f"%booster.score(X_train, Y_train))
This ends our tutorial explaining various functionalities available through the Python API of catboost.
References 
Other Gradient Boosted Machine Implementations
- XGBoost - An In-Depth Guide [Python]
- LightGBM - An In-Depth Guide [Python]
- Scikit-Learn - Ensemble Learning: Boosting
CatBoost Documentation
Other Useful Tutorials
 Sunny Solanki
Sunny Solanki
Intro: Software Developer | Youtuber | Bonsai Enthusiast
About: Sunny Solanki holds a bachelor's degree in Information Technology (2006-2010) from L.D. College of Engineering. Post completion of his graduation, he has 8.5+ years of experience (2011-2019) in the IT Industry (TCS). His IT experience involves working on Python & Java Projects with US/Canada banking clients. Since 2020, he’s primarily concentrating on growing CoderzColumn.
His main areas of interest are AI, Machine Learning, Data Visualization, and Concurrent Programming. He has good hands-on with Python and its ecosystem libraries.
Apart from his tech life, he prefers reading biographies and autobiographies. And yes, he spends his leisure time taking care of his plants and a few pre-Bonsai trees.
Contact: sunny.2309@yahoo.in


![YouTube Subscribe]() Comfortable Learning through Video Tutorials?
Comfortable Learning through Video Tutorials?
If you are more comfortable learning through video tutorials then we would recommend that you subscribe to our YouTube channel.
![Need Help]() Stuck Somewhere? Need Help with Coding? Have Doubts About the Topic/Code?
Stuck Somewhere? Need Help with Coding? Have Doubts About the Topic/Code?
 Stuck Somewhere? Need Help with Coding? Have Doubts About the Topic/Code?
When going through coding examples, it's quite common to have doubts and errors.
If you have doubts about some code examples or are stuck somewhere when trying our code, send us an email at coderzcolumn07@gmail.com. We'll help you or point you in the direction where you can find a solution to your problem.
You can even send us a mail if you are trying something new and need guidance regarding coding. We'll try to respond as soon as possible.
![Share Views]() Want to Share Your Views? Have Any Suggestions?
Want to Share Your Views? Have Any Suggestions?
 Want to Share Your Views? Have Any Suggestions?
If you want to
- provide some suggestions on topic
- share your views
- include some details in tutorial
- suggest some new topics on which we should create tutorials/blogs
 catboost