How to Use "memory_profiler" to Profile Memory Usage by Python Code?
With the rise in the primary memory of computer systems, we generally do not run out of memory. This is the reason we do not monitor primary memory usage.
But with the rise in data over time, it can happen that we might still run out of memory. To avoid those kinds of scenarios, we need to monitor which part of the code is using how much memory so that we can avoid such problems from happening again in the future.
What is Memory Profiling?
The process of analyzing memory usage by different parts of code is referred to as memory profiling. It is one kind of profiling where we measure space complexity (memory consumption) of a program/process. Another one is time profiling where we measure time complexity.
Nowadays, Python has been the go-to language for data scientists worldwide for analysis of big datasets. It does provide various libraries to perform profiling.
- memory profiling: memory_profiler, memprof, guppy/hpy, tracemalloc, Scalene, Pympler etc.
- time profiling: cProfile, profile, line_profiler, Scalene, yappi, pprofile, Snakeviz, Pyinstrument, py-spy, etc.
What Can You Learn From This Article?
As a part of this tutorial, we have explained in-depth how to use Python library memory_profiler to analyze memory consumption by Python code as well as processes. It's written totally in Python and monitors memory usage by processes as well as line-by-line memory usage by Python programs. It works almost like line_profiler which profiles time. The library is built on top of psutil module of python.
Below, we have listed different ways in which we can perform memory usage using "memory_profiler".
Ways to Profile Memory Usage Of Python Code using "memory_profiler"
- "@profile Decorator" (Covered in Sections 1-3 Below):
- Let us profile memory usage of individual Python functions. Provide statistics showing memory usage by an individual line of python code.
- "mprof Shell/Command Line Command" (Covered in Sections 4-7):
- Let us profile memory usage of whole Python script (".py" file) as a function of time. It'll let us analyze memory usage during code run time rather than by individual line of code.
- "memory_usage() function" (Covered in Section 8):
- Let us profile memory usage of process, python statements, and Python functions for a specified time interval.
- "mprun & memit cell/line Magic commands of Jupyter notebook" (Covered in Section 9):
- Let us profile memory usage of individual python statement or code of whole cell in Jupyter Notebook.
List Of Available Backends
The "memory_profiler" library uses "psutil" backend as default profiling backed. It does provide other backends to profile memory usage which we have listed below. The first three ways ("@profile", "memprof" & "memory_usage()") listed above let us choose between different backends.
- 'psutil'
- 'psutil_pss'
- 'psutil_uss'
- 'posix'
- 'tracemalloc'
Please make a note that memory_profiler generates memory consumption by querying underlying operating system kernel which is bit different from python interpreter. It uses psutil module for retrieving memory allocated by a current process running code. Apart from that, based on python garbage collection, results might be different on different platforms or between different runs of same code.
Below, we have listed essential sections of Tutorial to give an overview of the material covered.
Important Sections Of Tutorial
- How to Profile Individual Functions using "@profile" Decorator?
- Prints Memory Profile Statistics with High Precision
- Stream Profiling Results to Log File
- "mprof": Time-based Memory Profiling Of Python Script from Command Line/Shell
- 4.1 Profile Script using "mprof run"
- 4.2. Display Memory Profile Chart using "mprof plot"
- 4.3. Other Useful Arguments of "mprof run"
- Modify Memory Profiling Chart from "mprof plot"
- 5.1 Give Chart a Title
- 5.2 Plot Chart Timestamps as Flame Graph
- 5.3 Plot Memory Usage Trend Line and Its Numerical Slope
- 5.4 Save a Plot
- 5.5 Do not Display Individual Function Timestamps
- Other Useful "mprof" Commands
- 6.1 List All Profiling Files
- 6.2 Print Peak Usage
- 6.3 Remove Individual Profiling File
- 6.4 Clean All Profiling Files from Directory
- How to Use "mprof" with Multiprocessing?
- "memory_usage()": Profile Memory Usage Of Process/Code for Specified Time Period
- 8.1 Profile Memory Usage Of a Current Process for Specified Time Interval
- 8.2 Profile Memory Usage Of Specific Process (Process ID) for Specified Time Interval
- 8.3 Profile Memory Usage of Python Function for Specified Time Interval
- 8.4 Profile Python Function that Creates Multiple Processes for Specified Time Interval
- How to use "memory_profiler" in Jupyter Notebook?
- 9.1 Load "memory_profiler" in Jupyter Notebook
- 9.2 "%mprun" Line Magic Command
- 9.3 "%%mprun" Cell Magic Command
- 9.4 "%memit" Line Magic Command
How to Install "memory_profiler"?
- pip install -U memory_profiler
import memory_profiler

print("Memory Profiler Version : {}".format(memory_profiler.__version__))
1. How to Profile Individual Functions using "@profile" Decorator? 
As a part of our first example, we'll explain how we can decorate any function of code with the @profile decorator of memory_profiler and then record memory usage of that function by running script along with profiler. The "profile()" is a Python decorator function hence we can wrap any function in it as well.
1.1 Profile Simple Individual Function
Below we have created a simple script with one function which generates a list of 100000 random numbers between 1-10. It then adds index-wise elements of both list and keep them in the third list. It then sums up third list of elements and returns the total. We have decorated function with @profile decorator to monitor memory usage in it.
example1.py
## example1.py

from memory_profiler import profile

@profile
def main_func():
    import random
    arr1 = [random.randint(1,10) for i in range(100000)]
    arr2 = [random.randint(1,10) for i in range(100000)]
    arr3 = [arr1[i]+arr2[i] for i in range(100000)]
    del arr1
    del arr2
    tot = sum(arr3)
    del arr3
    print(tot)

if __name__ == "__main__":
    main_func()
We can now run the below-mentioned code into the command prompt/shell in order to analyze memory usage of the function.
Please make a NOTE that we have included "!" at the beginning of the command because we have executed it from Jupyter Notebook. But if you are running a command in shell/command prompt then you don't need to include it. We have run all commands in notebook hence you'll see it in all of them.
Jupyter Notebook let us execute shell commands by prefixing them with an exclamation mark.
!python -m memory_profiler example1.py
The output generated using the memory profiler is very self-explanatory. It shows two columns named Mem usage and Increment next to each line of function which is decorated with @profile.
We can see that it starts with some memory and then increases memory as arrays are created and decrease memory as an array is deallocated. There is also a column named Occurrences which shows a number of instances of items of the same type (in our case random integers).
The total memory usage at any time will be displayed in the Mem usage column and increment in memory usage due to the execution of a particular statement in the Increment column. This gives us the best idea of how much memory in total is getting used and how much a particular variable is using for better decision-making.
1.2 Profile Simple Individual Function Cont..
Below we have modified the example1.py file by removing the "del" statement which was deleting unused variables and then has profiled code.
example1_modified.py
## example1_modified.py

from memory_profiler import profile

@profile
def main_func():
    import random
    arr1 = [random.randint(1,10) for i in range(100000)]
    arr2 = [random.randint(1,10) for i in range(100000)]
    arr3 = [arr1[i]+arr2[i] for i in range(100000)]
    tot = sum(arr3)
    print(tot)

if __name__ == "__main__":
    main_func()
We'll be running the example1_modified.py file through the profiler exactly the same way as the previous file.
!python -m memory_profiler example1_modified.py
We can clearly see from the output of the modified file that it uses more memory as we are not deallocating memory used by arr1, arr2, and arr3 after their usage is done. These kinds of unused variables can pile up over time and flood memory with unused data which is not needed anymore. We can use memory_profiler to find out such code.
2. Prints Memory Profile Statistics with High Precision 
We can even modify the precision of memory usage getting displayed in two columns by giving 'precision' parameter with value to the @profile decorator.
example1_modified.py
## example1_modified.py

from memory_profiler import profile

@profile(precision=4)
def main_func():
    import random
    arr1 = [random.randint(1,10) for i in range(100000)]
    arr2 = [random.randint(1,10) for i in range(100000)]
    arr3 = [arr1[i]+arr2[i] for i in range(100000)]
    tot = sum(arr3)
    print(tot)

if __name__ == "__main__":
    main_func()
!python -m memory_profiler example1_modified.py
3. Stream Profiling Results to Log File 
The memory_profiler also lets us relocate the output of profiling to any log file.
This can be useful when we have too many functions to profile and the output of profilers can flood standard output. In this kind of scenario, it's better to output profiling results to the log file.
We can simply pass the file pointer to the 'stream' parameter of the @profile decorator of a method and it'll redirect the profiling result for that function to log file of the stream.
To explain streaming to log files, we have created a simple script below which has three functions each having the same code for generating a random array of size 1000x1000. Each function stops for some amount of time, generates a random array, takes a mean of an array, and returns it. The function that calls all three function prints returned averages.
Below we have regenerated our previous example with streaming profiling results to the report.log file.
## random_number_generator.py

import time
import numpy as np
from memory_profiler import profile

fp = open("report.log", "w+")

@profile(stream = fp)
def very_slow_random_generator():
    time.sleep(5)
    arr1 = np.random.randint(1,100, size=(1000,1000))
    avg = arr1.mean()
    return avg

@profile(stream = fp)
def slow_random_generator():
    time.sleep(2)
    arr1 = np.random.randint(1,100, size=(1000,1000))
    avg = arr1.mean()
    return avg

@profile(stream = fp)
def fast_random_generator():
    time.sleep(1)
    arr1 = np.random.randint(1,100, size=(1000,1000))
    avg = arr1.mean()
    return avg

@profile(stream = fp)
def main_func():
    avg1 = fast_random_generator()
    avg2 = slow_random_generator()
    avg3= very_slow_random_generator()

    print("Averages: {:.3f}, {:.3f}, {:.3f}".format(avg1,avg2,avg3))

if __name__ == '__main__':
    main_func()
We can run the above file as per the below command and the output won't be printed in standard out but will be directed to the log file.
!python -m memory_profiler random_number_generator.py
!cat report.log
Please make a NOTE that "@profile" decorator has one important argument named 'backend' that let us specify backend to use for profiling. As we had explained, it uses "psutil" as default backend. Other backend names can be provided as a string.
We would recommend that you stick to "psutil" as other backends do not seem reliable as of now.
4. "mprof": Time-based Memory Profiling Of Python Script from Command Line/Shell
When you install memory_profiler, it also gives us access to 'mprof' executable from the command line/shell.
The mprof command provides us with information about the usage of memory over time of the execution of the script. This can be very useful for analysis to understand which part of the script is taking more memory as well as when the memory usage is rising.
Apart from script, "mprof" command can be used to profile memory usage of Python module and Python executable as well.
The mprof command records memory usage at every 0.1 second when the script is running and stores it in a .dat file.
It even provides plotting functionality which plots memory usage as a function of time using matplotlib.
We'll now explain further how we can use mprof command to get more insights into memory usage over time.
4.1 Profile Script using "mprof run"
We'll use our script from previous example to explain the usage of mprof.
random_number_generator.py
## random_number_generator.py

import time
import numpy as np

@profile
def very_slow_random_generator():
    time.sleep(5)
    arr1 = np.random.randint(1,100, size=(1000,1000))
    avg = arr1.mean()
    return avg

@profile
def slow_random_generator():
    time.sleep(2)
    arr1 = np.random.randint(1,100, size=(1000,1000))
    avg = arr1.mean()
    return avg

@profile
def fast_random_generator():
    time.sleep(1)
    arr1 = np.random.randint(1,100, size=(1000,1000))
    avg = arr1.mean()
    return avg

@profile
def main_func():
    avg1 = fast_random_generator()
    avg2 = slow_random_generator()
    avg3 = very_slow_random_generator()

    print("Averages: {:.3f}, {:.3f}, {:.3f}".format(avg1,avg2,avg3))

if __name__ == '__main__':
    main_func()
We can run the above script through the mprof command as explained below.
!mprof run random_number_generator.py
The above command will execute the script and generate the new file by name mprofile_[current_datetime].dat (mprofile_20220803182143.dat).
By default, file name defaults to 'mprofile_YYYYMMDDhhmmss.dat' in the current directory (where 'YYYYMMDDhhmmss' is the date-time of sampling memory usage). This file contains the process memory consumption, in Mb (one value per line).
!head -n 10 mprofile_20220803182143.dat
!tail -n 10 mprofile_20220803182143.dat
Currently, our script is not taking any input arguments. But if you have designed a script that takes argument then you can give it immediately after script name as explained below.
- mprof run random_number_generator.py ARG1 ARG2
4.2. Display Memory Profile Chart using "mprof plot"
We can now call plotting functionality using the below command to plot usage of memory.
- mprof plot
The above command will take the latest ".dat" file generated and plot it using matplotlib.
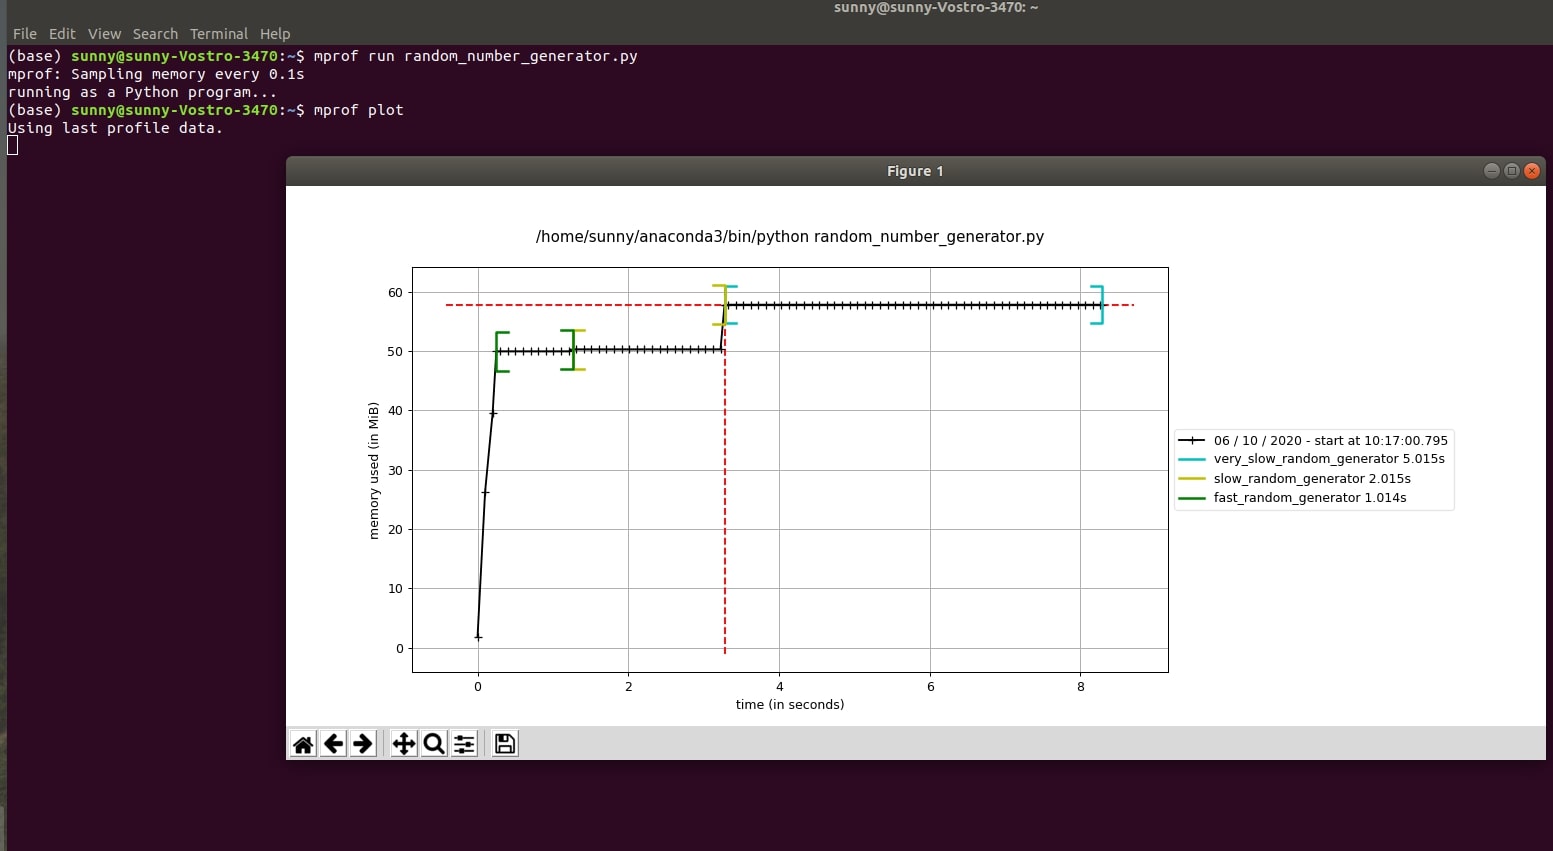
Please make a note of brackets shown highlighting function start and end. We'll not get this brackets if we don't decorate functions using @profile. We'll still get a graph for the usage of memory over time.
4.3. Other Useful Arguments of "mprof run"
If you want to know about all possible arguments of "mprof run" command then execute "mprof run -h" in shell/command prompt. It'll list all of them. Below, we have listed the ones which we think are important to mention.
- --interval INTERVAL or -T INTERVAL - As we had mentioned earlier, "mprof" records memory usage every "0.1" second by default. We can override this setting using this parameter. We can give time interval in seconds here.
- --timeout TIMEOUT or -t TIMEOUT - By default, "mprof" monitors total execution of program/process. We can instruct it to stop monitoring after a specified amount of time using this parameter. It let us specify a time in seconds.
- --output FILENAME or -o FILENAME - We can direct the result of profiling to an output file using this command. By default, "mprof" creates a file named "mprofile_datetime.dat". We can override that using this argument.
- --backend BACKEND - This command let us specify backend for profiling. The default is "psutil" as we had mentioned a few times earlier. We would recommend users to stick to default as other backends do not seem reliable yet.
Other arguments like --include-children / -C and --multiprocess / -M are explained through next example.
5. Modify Memory Profiling Chart from "mprof plot"
5.1 Give Chart a Title
We can also different file name which was previously generated after "mprof plot FILENAME" to generate a plot of that file. We can also give a title to a plot of our choice by using "-t" or "--title" option as explained below.
- mprof plot -t 'Random Number Generator Memory Footprints'
The plot for our random_number_generator.py file looks like this:
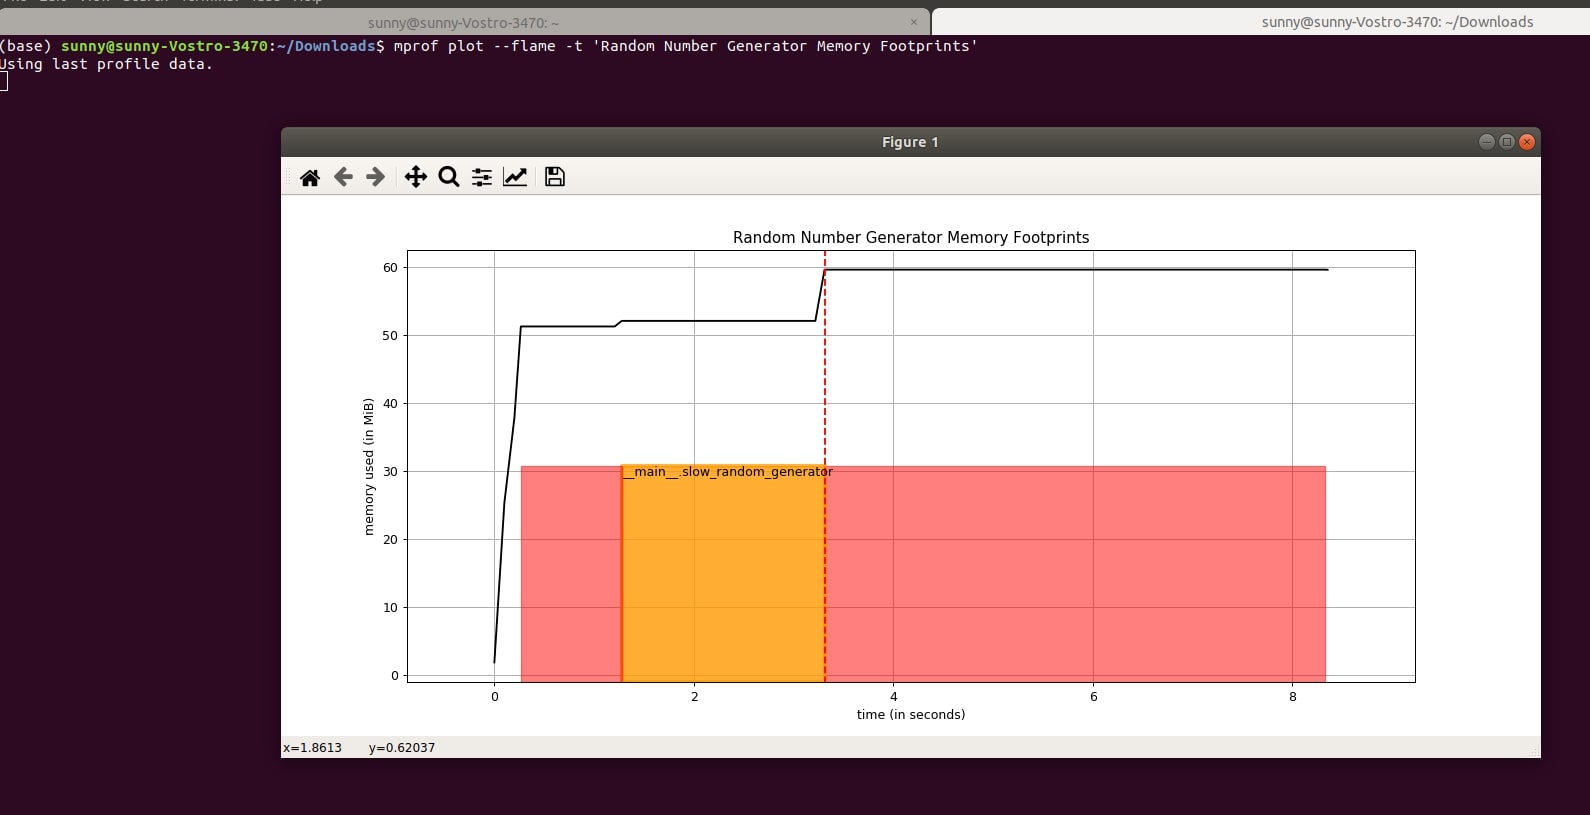
5.2 Plot Chart Timestamps as Flame Graph
The "mprof plot" command has argument "-f" or "--flame" that let us display function completion timestamps as flame graph. By default, it is displayed as brackets.
- mprof plot --flame -t 'Random Number Generator Memory Footprints'
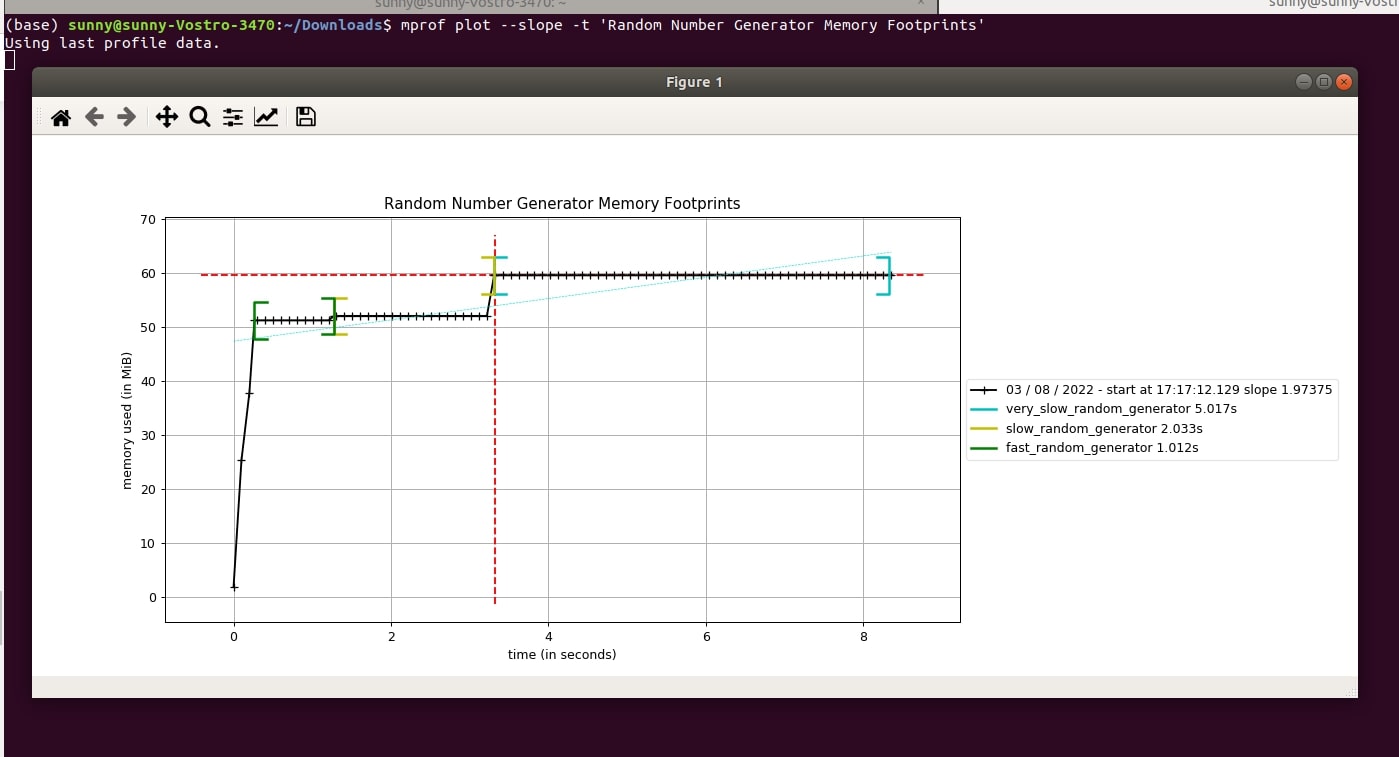
5.3 Plot Memory Usage Trend Line and Its Numerical Slope
The "mprof plot" command provides an argument named "--slope" or "-s" that let us create a trend line of memory usage. Below we have created one for our case. It is shown as a dotted blue line.
- mprof plot --slope -t 'Random Number Generator Memory Footprints'
- mprof plot -s -t 'Random Number Generator Memory Footprints'
5.4 Save a Plot
We can save the output plot from "mprof plot" command to a file using arguments "--output FILENAME" or "-o FILENAME". It let us save plots in different formats like JPG, PNG, etc. Below, we have created one for our case and then displayed it using Python module Pillow
- mprof plot -o mprof_res.png -t 'Random Number Generator Memory Footprints'
- mprof plot --output mprof_res.png -t 'Random Number Generator Memory Footprints'
- mprof plot -o mprof_res.jpg -t 'Random Number Generator Memory Footprints'
from PIL import Image

Image.open("mprof_res.jpg")
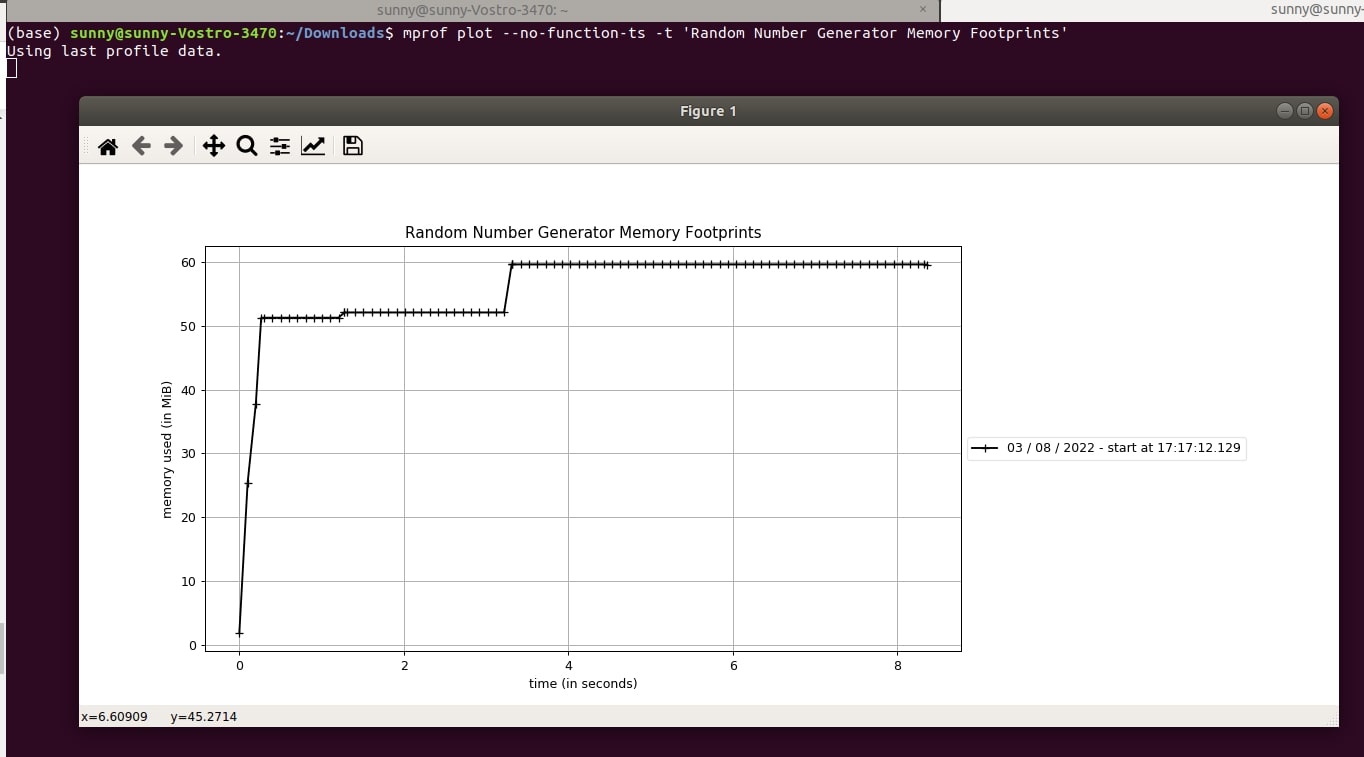
5.5 Do not Display Individual Function Timestamps
By default, "mprof plot" command displays brackets showing function memory usage. We can prevent it using "--no-function-ts" or "-n" arguments.
- mprof plot --no-function-ts -t 'Random Number Generator Memory Footprints'
- mprof plot --n -t 'Random Number Generator Memory Footprints'
5.6 Specify Matplotlib Backend
The "mprof plot" command uses matplotlib to plot charts. We can change charting backend of matplotlib using argument "--backend BACKEND". It provides many backends (['GTK3Agg', 'GTK3Cairo', 'MacOSX', 'nbAgg', 'Qt4Agg', 'Qt4Cairo', 'Qt5Agg', 'Qt5Cairo', 'TkAgg', 'TkCairo', 'WebAgg', 'WX', 'WXAgg', 'WXCairo', 'agg', 'cairo', 'pdf', 'pgf', 'ps', 'svg', 'template']).
6. Other Useful "mprof" Commands
Below are some other useful commands available with mprof:
- mprof list - It'll list all .dat files generated by mprof.
- mprof clean - It'll clean all .dat files.
- mprof rm - It can be useful to remove any particular .dat file.
- mprof peak - It prints maximum memory used during profiling.
6.1 List All Profiling Files
!mprof list
6.2 Print Peak Usage
!mprof peak
6.3 Remove Individual Profiling File
!mprof rm mprofile_20220803165937.dat
!mprof list
6.4 Clean All Profiling Files from Directory
!mprof clean
!mprof list
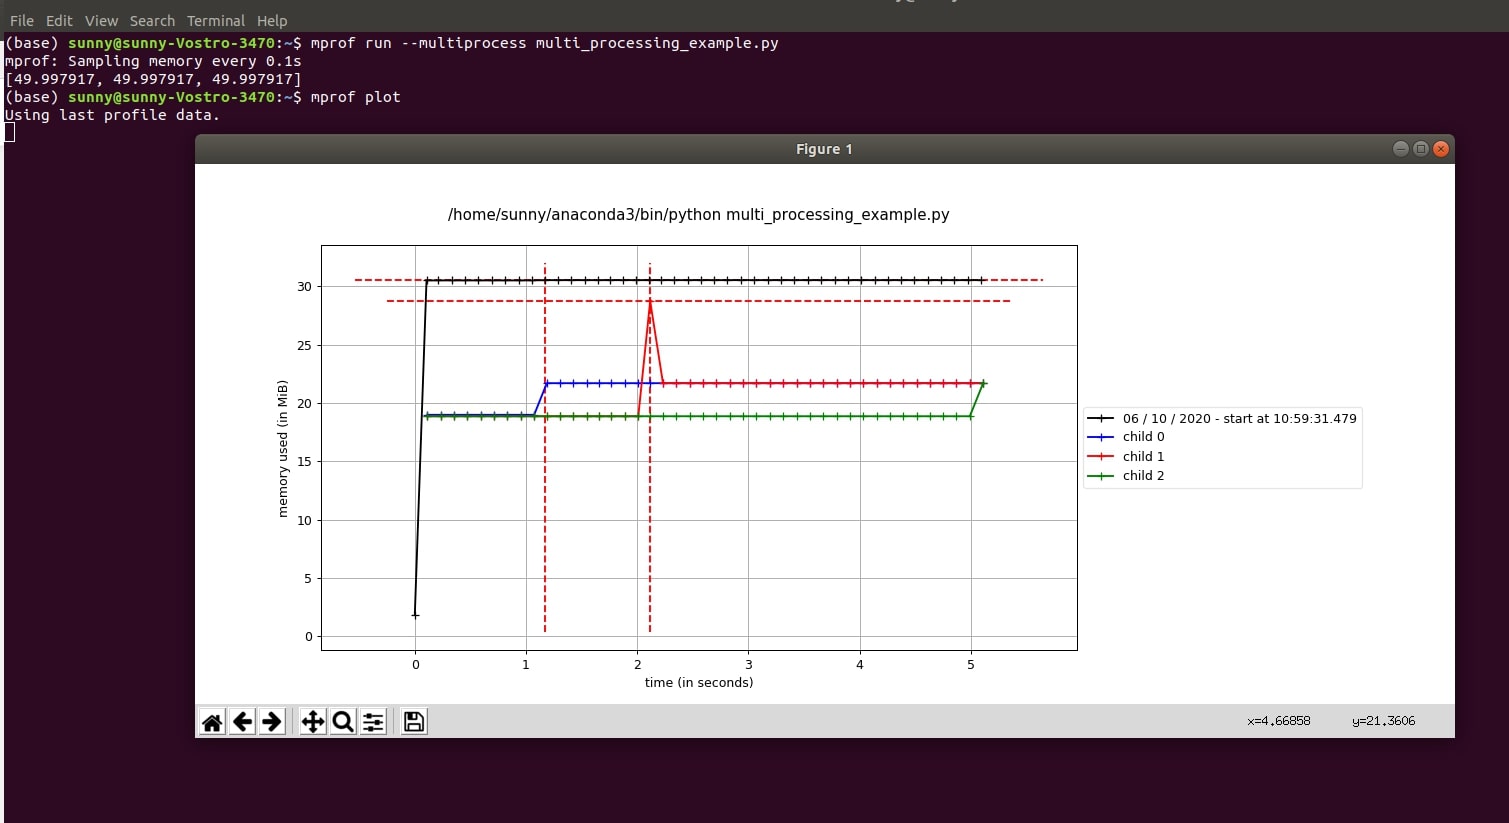
7. How to Use "mprof" with Multiprocessing?
The mprof command also provides memory usage monitoring in the context of multiprocessing. It provides two options for monitoring memory usage in the case of multiprocessing.
- --include-children - It monitors memory usage across all children of process and shows their usage as one line chart.
- --multiprocess - It generates a sample line chart for each sub-process and their memory usage per time.
Below we have modified our python code from the previous examples to show usage of this option. We are creating a multiprocessing pool and submitting three functions for generating an average of random numbers to it. We'll be monitoring memory usage in each process using mprof.
multi_processing_example.py
## multi_processing_example.py

import time
import numpy as np
from concurrent.futures import ProcessPoolExecutor

def very_slow_random_generator():
    time.sleep(5)
    arr1 = np.random.randint(1,100, size=(1000,1000))
    avg = arr1.mean()
    return avg

def slow_random_generator():
    time.sleep(2)
    arr1 = np.random.randint(1,100, size=(1000,1000))
    avg = arr1.mean()
    return avg

def fast_random_generator():
    time.sleep(1)
    arr1 = np.random.randint(1,100, size=(1000,1000))
    avg = arr1.mean()
    return avg

def main_func():
    ppe = ProcessPoolExecutor(max_workers=3)
    futures = []

    futures.append(ppe.submit(fast_random_generator))
    futures.append(ppe.submit(slow_random_generator))
    futures.append(ppe.submit(very_slow_random_generator))

    print([future.result() for future in futures])

if __name__ == '__main__':
    main_func()
We'll execute the below command to generate a memory usage file for multi_processing_example.py.
!mprof run --multiprocess multi_processing_example.py
We'll then plot it using the below command.
- mprof plot
Output Plot
8. "memory_usage()": Profile Memory Usage Of Process/Code for Specified Time Period
The memory_profiler provides another important method named memory_usage() which can be used for memory profiling over time.
What can be profiled using "memory_usage()" Function?
- Process: We need to provide process id as an integer or string.
- Python Function - The function followed by its arguments needs to be provided as a tuple.
8.1 Profile Memory Usage Of Processes for Specified Time Interval
8.1.1 Profile Current Process
We can call the memory_usage() method with -1 as the first parameter and it'll monitor the memory usage of the current process.
We have specified other parameter interval as 0.2 that measures memory usage every 0.2 seconds and timeout as 1 second meaning that stops measuring after 1 second and return results. It returns memory usage monitored for a specified time in "MB".
Below we are monitoring memory usage of the current process which is a process running jupyter notebook ipython kernel. The output has 5 values because we sampled memory usage every 0.2 seconds for 1 second time interval.
from memory_profiler import memory_usage
mem_usage = memory_usage(-1, interval=.2, timeout=1)
mem_usage
8.1.1 Return Timestamps with Memory Usage
We can instruct "memory_usage()" command to return timestamps of recording by setting timestamps parameter to True.
mem_usage = memory_usage(-1, interval=.2, timeout=1, timestamps=True)

mem_usage
8.1.2 Return Only Peak Memory Usage Value
If we want to know just peak memory usage value during a time interval then we can do it by setting 'max_usage' to True in "memory_usage()" call.
mem_usage = memory_usage(-1, interval=.2, timeout=1, max_usage=True)

mem_usage
8.1.3 Save Memory Usage to a File
We can save profiling results to a text file by giving file pointer to 'stream' parameter of "memory_usage()" function.
memory_usage(-1, interval=.2, timeout=2, timestamps=True, stream=open("memory_usage.txt", "w"))
!cat memory_usage.txt
8.1.4 Try Different Profiling Backends
The "memory_usage()" method has a parameter named 'backend' that let us specify backend to use for memory profiling. The default is "psutil" as we had mentioned a few times earlier. We would recommend sticking to it as it is more reliable than others.
8.2 Profile Memory Usage Of Specific Process (Process ID) for Specified Time Interval
Here, we have explained how we can monitor memory usage of a specific process. We can give process id to "memory_usage()" function.
Below, we have retrieved process id of Jupyter notebook and given it to function for memory usage monitoring.
!ps aux | grep notebook
memory_usage(5723, interval=.2, timeout=2)
8.3 Profile Memory Usage of Python Function for Specified Time Interval
In this section, we have explained how to profile memory usage of a function using memory_usage() method.
We have redefined the function very_slow_random_generator from our previous examples. We are calling it with an interval of 0.1 seconds. We have also set timestamps to True so that it'll return timestamps at which memory usage was recorded as well.
import time
import numpy as np

def very_slow_random_generator(sz=1000):
    time.sleep(5)
    arr1 = np.random.randint(1,100, size=(sz, sz))
    avg = arr1.mean()
    return avg
mem_usage = memory_usage((very_slow_random_generator, (10000,), ), timestamps=True, interval=0.1)

mem_usage
8.4 Profile Python Function that Creates Multiple Processes for Specified Time Interval
The memory_usage() function lets us measure memory usage in a multiprocessing environment like mprof command but from code directly rather than from a command prompt/shell like mprof. It provides both option include_children and multiprocess which were available in mprof command.
We have regenerated code from our previous examples on multiprocessing and used memory_usage() to measure memory usage in the multiprocessing examples. We have tried both include_children and multiprocess parameters.
import time
import numpy as np
from concurrent.futures import ProcessPoolExecutor

def very_slow_random_generator():
    time.sleep(5)
    arr1 = np.random.randint(1,100, size=(1000,1000))
    avg = arr1.mean()
    return avg

def slow_random_generator():
    time.sleep(2)
    arr1 = np.random.randint(1,100, size=(1000,1000))
    avg = arr1.mean()
    return avg

def fast_random_generator():
    time.sleep(1)
    arr1 = np.random.randint(1,100, size=(1000,1000))
    avg = arr1.mean()
    return avg

def main_func():
    ppe = ProcessPoolExecutor(max_workers=3)
    futures = []

    futures.append(ppe.submit(fast_random_generator))
    futures.append(ppe.submit(slow_random_generator))
    futures.append(ppe.submit(very_slow_random_generator))

    print([future.result() for future in futures])

mem_usage = memory_usage((main_func,), interval=1, include_children=True)
mem_usage
mem_usage = memory_usage((main_func,), interval=1, multiprocess=True)
mem_usage
9. How to use memory_profiler in Jupyter Notebook?
We can load memory_profiler as an external extension in Python jupyter notebook to measure memory usage of various functions and code. We can load memory_profiler in the jupyter notebook as an external extension with the below command.
9.1 Load "memory_profiler" in Jupyter Notebook
If you are someone who is new to magic commands in Notebooks then we would recommend that you check our tutorial on it in your free time. It'll help you better manage notebooks.
%load_ext memory_profiler
The memory_profiler provides 2 line magic commands and 2 cell magic commands to be used in jupyter notebooks.
- Line Magic Commands : %mprun & %memit
- Cell Magic Commands : %%mprun & %%memit
The mprun commands return the same output as that of '@profile' decorator. It'll open the output in a separate window in the jupyter notebook.
The memit command returns peak memory (like mprof peak) used by a line of code in the cell.
9.2 "%mprun" Line Magic Command
9.2.1 Profiling One Function
Below we are loading the very_slow_random_generator() function from the random_number_generator.py file which we created in our previous example.
Then, we are calling the %mprun command on it. We need to register all functions that we want to monitor with command by giving their name followed by "-f" argument. After registering, we call function name that we want to execute.
Please make a NOTE when using "memory_profiler" in Jupyter Notebook, it'll open results in a new small tab. If you want to print results in a notebook then you need to decorate functions with "@profile" decorator discussed earlier.
For our case, we have not decorated functions with "@profile" decorator.
from random_number_generator import very_slow_random_generator

%mprun -f very_slow_random_generator very_slow_random_generator()
Filename: /home/sunny/Downloads/random_number_generator.py

Line #    Mem usage    Increment  Occurrences   Line Contents
=============================================================
     7     62.1 MiB     62.1 MiB           1   def very_slow_random_generator():
     8     62.1 MiB      0.0 MiB           1       time.sleep(5)
     9     69.8 MiB      7.7 MiB           1       arr1 = np.random.randint(1,100, size=(1000,1000))
    10     69.8 MiB      0.0 MiB           1       avg = arr1.mean()
    11     69.8 MiB      0.0 MiB           1       return avg
9.2.2 Profiling Multiple Functions
Here, we have explained how we can monitor multiple functions using "%mprun" line command.
from random_number_generator import very_slow_random_generator,\
                                    slow_random_generator,\
                                    fast_random_generator,\
                                    main_func

%mprun -f very_slow_random_generator -f slow_random_generator -f fast_random_generator -f main_func main_func()
Filename: /home/sunny/Downloads/random_number_generator.py

Line #    Mem usage    Increment  Occurrences   Line Contents
=============================================================
     7     69.6 MiB     69.6 MiB           1   def very_slow_random_generator():
     8     69.6 MiB      0.0 MiB           1       time.sleep(5)
     9     69.6 MiB      0.0 MiB           1       arr1 = np.random.randint(1,100, size=(1000,1000))
    10     69.6 MiB      0.0 MiB           1       avg = arr1.mean()
    11     69.6 MiB      0.0 MiB           1       return avg


Filename: /home/sunny/Downloads/random_number_generator.py

Line #    Mem usage    Increment  Occurrences   Line Contents
=============================================================
    13     62.1 MiB     62.1 MiB           1   def slow_random_generator():
    14     62.1 MiB      0.0 MiB           1       time.sleep(2)
    15     69.6 MiB      7.5 MiB           1       arr1 = np.random.randint(1,100, size=(1000,1000))
    16     69.6 MiB      0.0 MiB           1       avg = arr1.mean()
    17     69.6 MiB      0.0 MiB           1       return avg


Filename: /home/sunny/Downloads/random_number_generator.py

Line #    Mem usage    Increment  Occurrences   Line Contents
=============================================================
    19     61.8 MiB     61.8 MiB           1   def fast_random_generator():
    20     61.8 MiB      0.0 MiB           1       time.sleep(1)
    21     69.5 MiB      7.7 MiB           1       arr1 = np.random.randint(1,100, size=(1000,1000))
    22     69.5 MiB      0.0 MiB           1       avg = arr1.mean()
    23     69.5 MiB      0.0 MiB           1       return avg


Filename: /home/sunny/Downloads/random_number_generator.py

Line #    Mem usage    Increment  Occurrences   Line Contents
=============================================================
    25     61.8 MiB     61.8 MiB           1   def main_func():
    26     62.1 MiB     62.1 MiB           1       avg1 = fast_random_generator()
    27     69.6 MiB     69.6 MiB           1       avg2 = slow_random_generator()
    28     69.6 MiB     69.6 MiB           1       avg3 = very_slow_random_generator()
    29
    30     69.6 MiB      0.0 MiB           1       print("Averages: {:.3f}, {:.3f}, {:.3f}".format(avg1,avg2,avg3))
9.2.3 How to Store Profiling Results to a File?
Both line and cell "mprun" command provide an argument named "-T FILENAME" that let us save profiling results to a file. This can be useful when profiling a very long function or many functions that can flood output.
from random_number_generator import very_slow_random_generator

%mprun -f very_slow_random_generator -T profile_dump.log very_slow_random_generator()
!cat profile_dump.log
9.2.3 Monitor Child Processes
Both mprun line and cell magic commands have an argument named '-c' that let us monitor memory usage by child processes.
9.3 "%%mprun" Cell Magic Command
9.3.1 Single Function
Below we are loading the function very_slow_random_generator() as a cell function and whenever it'll be called in a cell that many times memory profiling will be recorded.
from random_number_generator import very_slow_random_generator
%%mprun -f very_slow_random_generator

very_slow_random_generator()
Filename: /home/sunny/Downloads/random_number_generator.py

Line #    Mem usage    Increment  Occurrences   Line Contents
=============================================================
     7     61.9 MiB     61.9 MiB           1   def very_slow_random_generator():
     8     61.9 MiB      0.0 MiB           1       time.sleep(5)
     9     69.8 MiB      8.0 MiB           1       arr1 = np.random.randint(1,100, size=(1000,1000))
    10     69.8 MiB      0.0 MiB           1       avg = arr1.mean()
    11     69.8 MiB      0.0 MiB           1       return avg
9.3.2 Multiple Functions
Here, we have explained the usage of "%%mprun" cell commands for multiple functions.
from random_number_generator import very_slow_random_generator,\
                                    slow_random_generator,\
                                    fast_random_generator,\
                                    main_func
%%mprun -f very_slow_random_generator -f slow_random_generator -f fast_random_generator

avg1 = very_slow_random_generator()
avg2 = slow_random_generator()
avg3 = fast_random_generator()

print("Averages: {:.3f}, {:.3f}, {:.3f}".format(avg1,avg2,avg3))
Filename: /home/sunny/Downloads/random_number_generator.py

Line #    Mem usage    Increment  Occurrences   Line Contents
=============================================================
     7     62.1 MiB     62.1 MiB           1   def very_slow_random_generator():
     8     62.1 MiB      0.0 MiB           1       time.sleep(5)
     9     69.7 MiB      7.7 MiB           1       arr1 = np.random.randint(1,100, size=(1000,1000))
    10     69.7 MiB      0.0 MiB           1       avg = arr1.mean()
    11     69.7 MiB      0.0 MiB           1       return avg


Filename: /home/sunny/Downloads/random_number_generator.py

Line #    Mem usage    Increment  Occurrences   Line Contents
=============================================================
    13     62.3 MiB     62.3 MiB           1   def slow_random_generator():
    14     62.3 MiB      0.0 MiB           1       time.sleep(2)
    15     69.7 MiB      7.3 MiB           1       arr1 = np.random.randint(1,100, size=(1000,1000))
    16     69.9 MiB      0.3 MiB           1       avg = arr1.mean()
    17     69.9 MiB      0.0 MiB           1       return avg


Filename: /home/sunny/Downloads/random_number_generator.py

Line #    Mem usage    Increment  Occurrences   Line Contents
=============================================================
    19     69.9 MiB     69.9 MiB           1   def fast_random_generator():
    20     69.9 MiB      0.0 MiB           1       time.sleep(1)
    21     69.9 MiB      0.0 MiB           1       arr1 = np.random.randint(1,100, size=(1000,1000))
    22     69.9 MiB      0.0 MiB           1       avg = arr1.mean()
    23     69.9 MiB      0.0 MiB           1       return avg
9.4 "%memit" Line Magic Command
Below we are explaining how we can use the memit command to measure peak memory usage in a function. It does not require us to register functions in order to monitor peak usage.
The "%%memit" cell command works for whole cell and reports peak memory usage of the whole cell.
%memit very_slow_random_generator()
This ends our small tutorial explaining various ways to measure memory usage using memory_profiler. Below, we have listed other Python memory and time profilers.
Reference
Memory Profilers
- Memory Profiler PyPI
- guppy/heapy - Profile Memory Usage in Python
- pympler - Monitor Memory Usage by Python Objects
- Scalene - CPU and Memory Profiler for Python Code
- tracemalloc - How to trace memory usage in Python code
Time Profilers
- yappi - Yet Another Python Profiler
- pprofile - Deterministic and Statistical Profiler for Python Code
- How to Profile Python Code using cProfile & profile?
- line_profiler: Line by Line Profiling of Python Code
- Snakeviz - Visualize Profiling Results in Python
- py-spy - Sampling Profiler for Python Code
- pyinstrument - Statistical Profiler for Python Code
 Sunny Solanki
Sunny Solanki
Intro: Software Developer | Youtuber | Bonsai Enthusiast
About: Sunny Solanki holds a bachelor's degree in Information Technology (2006-2010) from L.D. College of Engineering. Post completion of his graduation, he has 8.5+ years of experience (2011-2019) in the IT Industry (TCS). His IT experience involves working on Python & Java Projects with US/Canada banking clients. Since 2020, he’s primarily concentrating on growing CoderzColumn.
His main areas of interest are AI, Machine Learning, Data Visualization, and Concurrent Programming. He has good hands-on with Python and its ecosystem libraries.
Apart from his tech life, he prefers reading biographies and autobiographies. And yes, he spends his leisure time taking care of his plants and a few pre-Bonsai trees.
Contact: sunny.2309@yahoo.in


![YouTube Subscribe]() Comfortable Learning through Video Tutorials?
Comfortable Learning through Video Tutorials?
If you are more comfortable learning through video tutorials then we would recommend that you subscribe to our YouTube channel.
![Need Help]() Stuck Somewhere? Need Help with Coding? Have Doubts About the Topic/Code?
Stuck Somewhere? Need Help with Coding? Have Doubts About the Topic/Code?
 Stuck Somewhere? Need Help with Coding? Have Doubts About the Topic/Code?
When going through coding examples, it's quite common to have doubts and errors.
If you have doubts about some code examples or are stuck somewhere when trying our code, send us an email at coderzcolumn07@gmail.com. We'll help you or point you in the direction where you can find a solution to your problem.
You can even send us a mail if you are trying something new and need guidance regarding coding. We'll try to respond as soon as possible.
![Share Views]() Want to Share Your Views? Have Any Suggestions?
Want to Share Your Views? Have Any Suggestions?
 Want to Share Your Views? Have Any Suggestions?
If you want to
- provide some suggestions on topic
- share your views
- include some details in tutorial
- suggest some new topics on which we should create tutorials/blogs
 profiling, memory_profiler