Pympler - Monitor Memory Usage By Python Objects
Python has different sets of libraries for performing memory profiling like memory_profiler, guppy/heapy, scalene, etc. All these libraries provide usage of memory by python code in different ways. But there is no provision of monitoring memory usage of object created using user-defined classes in any of them. There are situations where we need to monitor memory usage by a particular kind of object and a Python library named pympler can be very useful for those kinds of requirements. The pympler has a list of modules that lets us monitor memory usage by python code in various ways. As a part of this tutorial, we'll be explaining various modules available in pympler with examples.
Below is a list of modules that we'll discuss as a part of this tutorial.
- asizeof - This module provides us with various methods to measure the size of objects.
- classtracker - This module provides us with methods to monitor the memory usage of objects created by user define classes.
- classtracker_stats - This module lets us format data captured using the
classtrackermodule in different ways. - tracker - This module allows us to track changes in overall memory over time.
- muppy - This module lets us monitor memory usage by a list of objects over time.
- garbagegraph - This module lets us analyze objects which are creating a reference cycle hence becomes hard to collect by the garbage collector.
- refbrowser - This module lets us perform tree-like exploration of object referrers.
- refgraph - This module provides ways to illustrate objects and their references as directed graphs. It can even generate graphviz directed graphs.
- summary - This module provides functions to summarize information for a list of objects.
We'll start by importing pympler.
import pympler
asizeof
As a part of this section, we'll explore various methods available with asizeof module to find out memory usage by various objects.
- asizeof.asizeof() This method takes as input single or multiple objects and returns the size of each object in bytes.
Below we have created two lists where the first is an actual list with all elements and the second is the python generator. We have then measured the size of both of them using the asizeof() method.
from pympler import asizeof
l1 = [i for i in range(10)]
l2 = range(10)

print("Size of List l1              : %d bytes"%asizeof.asizeof(l1))
print("Size of List l1              : %d bytes"%asizeof.asizeof(l2))
print("Size of List l1,l2 Combined  : %d bytes"%asizeof.asizeof(l1,l2))
print("Size of List l1 & l2         : %d bytes, %d bytes"%asizeof.asizesof(l1, l2))
- asizeof.asized() - This method takes as input objects as input and returns a list of objects of type
pympler.asizeof.Asizedwhich has information about the memory usage of objects passed. - Asized.format() - This method lets us format memory information present for particular object. This gives us detailed insight into complex objects.
Below we have explained the usage of both methods with simple examples.
asized = asizeof.asized(l1)
print("Object Type : ", type(asized))
print(asized)
print("Flat Size : %d, Total Size : %d\n"%(asized.flat, asized.size))

asized_objs = asizeof.asized(l1,l2)
print(asized_objs[0].format())
print(asized_objs[1].format())

print("\nObject Stats : ")
print(asizeof.asized(l1, detail=0, stats=1).format())
print("\nObject Details : ")
print(asizeof.asized(l1, detail=1).format())
- itemsize() - This method returns size of single object as bytes from a list of objects.
- basicsize() - This method returns basic size of object as bytes.
- flatsize() - This method returns flat size of object as bytes.
- refs() - This method return list of objects referred by object passed to it.
We have explained how we can use the above methods.
print("Size of Single Item in a List : %d bytes"%asizeof.itemsize(l1))
print("Basic Size of Object          : %d bytes"%asizeof.basicsize(l1))
print("Flat Size of Object           : %d bytes"%asizeof.flatsize(l1))
print("List of Objects Referred by an Object : ", asizeof.refs(l1))
- isclass() - This method takes object as input and returns True if object is class else False.
- isbuiltin() - This method takes object as input and returns True if object is builtin python keyword else False.
- iscode() - This method takes object as input and returns True if object is code else False.
- isframe() - This method takes object as input and returns True if object is frame else False.
- isfunction() - This method takes object as input and returns True if object is function else False.
- ismethod() - This method takes object as input and returns True if object is method else False.
- ismodule() - This method takes object as input and returns True if object is module else False.
We have explained the usage of the above methods with simple examples below.
print("Is Object Class    : ",asizeof.isclass(l1))
print("Is Object Builtin  : ",asizeof.isbuiltin(l1))
print("Is Object Code     : ",asizeof.iscode(l1))
print("Is Object Frame    : ",asizeof.isframe(l1))
print("Is Object Function : ",asizeof.isfunction(l1))
print("Is Object method   : ",asizeof.ismethod(l1))
print("Is Object Module   : ",asizeof.ismodule(l1))

print()
import random

print("Is Object Module   : ",asizeof.ismodule(random))

print()
def method_test():
    return random.randint(1,100)

print()
print("Is Object Function : ",asizeof.ismethod(method_test))
print("Is Object method   : ",asizeof.isfunction(method_test))

class Testing:
    def __init__(self):
        pass

    def test_print(self):
        print("Testing Class")

testing  = Testing()

print()
print("Is Object Function : ",asizeof.ismethod(testing.test_print))
print("Is Object method   : ",asizeof.isfunction(testing.test_print))
print("Is Object Class    : ",asizeof.isclass(Testing))

print()
print("Is Object Builtin  : ",asizeof.isbuiltin(min))
print("Is Object Builtin  : ",asizeof.isbuiltin(sum))
print("Is Object Builtin  : ",asizeof.isbuiltin(max))
classtracker & classtracker_stats
As a part of this section, we'll explain through various examples how we can trace memory usage by particular kind of user-defined objects and then format stats of monitoring in different ways using classtracker and classtracker_stats modules.
Example 1
Our first example is a simple example that monitors memory usage by objects created using the class RandomNumbersGenerator. We have created a simple class named RandomNumbersGenerator which when instantiated with size generates a numpy array of that size with a random number in the range 1-100. We'll be monitoring all memory usage by all objects created using this class.
In order to trace memory usage by a particular class, we first need to create an instance of ClassTracker(). We then need to class which we want to monitor by calling the track_class() method of ClassTracker by giving it class reference and name as input. We can then call create_snapshot() on the ClassTracker instance and it'll record memory usage by objects of classes monitored by it at that time. We can call create_snapshot() as many times as we want and it'll record memory usage at all times. We can then call the print_summary() method from the stats object of ClassTracker and it'll print all memory snapshots taken for registered classes.
- classtracker.ClassTracker() - It creates an object which will be used to monitor the memory usage of an object of a particular type.
- ClassTracker.track_class() - It takes as input reference to class which we want to monitor.
- ClassTracker.create_snapshot() - It'll record memory usage by registered classes at the point when its called.
- ClassTracker.stats.print_summary() - It'll print all snapshots taken since beginning.
- ClassTracker.close() - It'll inform class tracker to stop monitoring everything.
Below we have explained the usage of methods by creating 3 lists and then deleting one list. We have taken snapshots at the beginning, after lists creation, and after one list deletion to notice changes.
import numpy as np

class RandomNumbersGenerator:
    def __init__(self, size):
        self.random_ints = np.random.randint(1,100, size)
from pympler import classtracker

ct = classtracker.ClassTracker()
ct.track_class(RandomNumbersGenerator, name=RandomNumbersGenerator.__name__)

ct.create_snapshot(description="Start")

rand1 = RandomNumbersGenerator((1000,1000))
rand2 = RandomNumbersGenerator((1000,1000))
rand3 = RandomNumbersGenerator((1000,1000))

ct.create_snapshot(description="Intermediate")

#ct.stats.print_stats()

del rand3

ct.create_snapshot(description="End")

ct.stats.print_summary()
ct.close()
Example 2
As a part of our second example, we'll be demonstrating how we can monitor more than one class using a class tracker and how to clear stats collected.
- ClassTracker.clear() - It clears all stats collected till now.
Below we have created another class named RandomDistribution which generates a random uniform distribution for size passed to it. We have explained how we can monitor the usage of both RandomDistribution and RandomNumbersGenerator classes.
class RandomDistribution:
    def __init__(self, size):
        self.uniform_dist = np.random.uniform(size=size)
from pympler import classtracker

ct = classtracker.ClassTracker()
ct.track_class(RandomNumbersGenerator, name=RandomNumbersGenerator.__name__)
ct.track_class(RandomDistribution, name=RandomDistribution.__name__)

ct.create_snapshot(description="Start")

rand1 = RandomNumbersGenerator((1000,1000))
rand2 = RandomNumbersGenerator((1000,1000))

unif_dist1 = RandomDistribution((100,100))
unif_dist2 = RandomDistribution((100,100))

ct.create_snapshot(description="Intermediate")

#ct.stats.print_stats()
del rand2, unif_dist2

ct.create_snapshot(description="End")

ct.stats.print_summary()

ct.clear()
ct.stats.print_summary()

ct.close()
Example 3
As a part of this example, we'll explain how we can inform the class tracker to monitor only a particular object of a class rather than all objects.
- ClassTracker.track_object() - This method will monitor memory usage by object passed to it.
- ClassTracker.track_change() - This method will monitor memory usage by object passed to it as well as changes to it.
Below we have created two RandomNumbersGenerator and two RandomDistribution objects. We are then monitoring them using the above described methods.
from pympler import classtracker

rand1 = RandomNumbersGenerator((1000,1000))
rand2 = RandomNumbersGenerator((1000,1000))

unif_dist1 = RandomDistribution((100,100))
unif_dist2 = RandomDistribution((100,100))

ct = classtracker.ClassTracker()
ct.track_object(rand1)
ct.track_change(rand1)
ct.track_object(rand2)
ct.track_change(rand2)
ct.track_object(unif_dist1)
ct.track_change(unif_dist1)
ct.track_object(unif_dist2)
ct.track_change(unif_dist2)

ct.create_snapshot(description="Start")

rand1.random_ints = np.random.randint(1,100, (100,100))

ct.create_snapshot(description="Intermediate")

del rand2

ct.create_snapshot(description="End")

ct.stats.print_summary()

#ct.stats.print_stats(clsname="RandomDistribution")

ct.close()
Example 4
As a part of this example, we'll explain how we can remove a class that we don't want to monitor as well as how we can dump monitoring stats to an output file that we can load later.
- ClassTracker.detach_class() - This method takes a class reference as input and removes that class from the monitoring list of a class tracker.
- ClassTracker.stats.sort_stats() - This method sorts stats of monitoring. We can give it sorting key like the name of the class, active, average, pct. etc.
- ClassTracker.stats.dump_stats() - This method dumps monitoring stats to an output file.
Below we have first registered two classes which we created earlier for monitoring, then created instances of classes, deleted a few instances, and then unregistered one class from monitoring. We have also taken a memory snapshot between steps. We have then checked whether it’s still monitoring a new instance of that class getting created. At last, we have stored monitoring stats to an output file.
from pympler import classtracker

ct = classtracker.ClassTracker()
ct.track_class(RandomNumbersGenerator, name=RandomNumbersGenerator.__name__)
ct.track_class(RandomDistribution, name=RandomDistribution.__name__)
ct.create_snapshot(description="Start")

rand1 = RandomNumbersGenerator((1000,1000))
rand2 = RandomNumbersGenerator((1000,1000))

unif_dist1 = RandomDistribution((100,100))
unif_dist2 = RandomDistribution((100,100))

ct.create_snapshot(description="Intermediate")

#ct.stats.print_stats()
del rand2, unif_dist2

ct.create_snapshot(description="End")

ct.stats.print_summary()

## Detaches "RandomNumbersGenerator".
## Already monitored instance will be monitored but future instance won't be monitored
## detach_all() and detach_all_classes() detaches all objects and classes.
ct.detach_class(RandomNumbersGenerator)

del rand1
rand3  = RandomNumbersGenerator((1000,1000))

ct.create_snapshot(description="Last")
ct.stats.sort_stats().print_summary()

print("Tracked Classes : ", ct.stats.tracked_classes)
ct.stats.dump_stats("pympler_stats.out")

ct.close()
The classtracker module has a ConsoleStats class which lets us load monitoring stats from a file. Below we have reloaded again monitoring stats store to a file in a previous step and printed stats again to verify.
ct = classtracker.ClassTracker()
console_stats = classtracker.ConsoleStats(ct, "pympler_stats.out")

console_stats.print_summary()
print("Tracked Classes : ",console_stats.tracked_classes)
Example 5
As a part of this example, we have again explained the usage of dumping stats to a file and then reloading it.
from pympler import classtracker

ct = classtracker.ClassTracker()
ct.track_class(RandomNumbersGenerator, name=RandomNumbersGenerator.__name__)
console_stats = classtracker.ConsoleStats(ct)

ct.create_snapshot(description="Start")

rand1 = RandomNumbersGenerator((1000,1000))
rand2 = RandomNumbersGenerator((1000,1000))
rand3 = RandomNumbersGenerator((1000,1000))

ct.create_snapshot(description="Intermediate")

#ct.stats.print_stats()

del rand3

ct.create_snapshot(description="End")

console_stats.print_summary()

console_stats.dump_stats("pympler_stats.out")
print("Tracked Classes : ",console_stats.tracked_classes)

ct.close()
ct = classtracker.ClassTracker()
console_stats = classtracker.ConsoleStats(ct, "pympler_stats.out")

console_stats.print_summary()
print("Tracked Classes : ",console_stats.tracked_classes)
Example 6
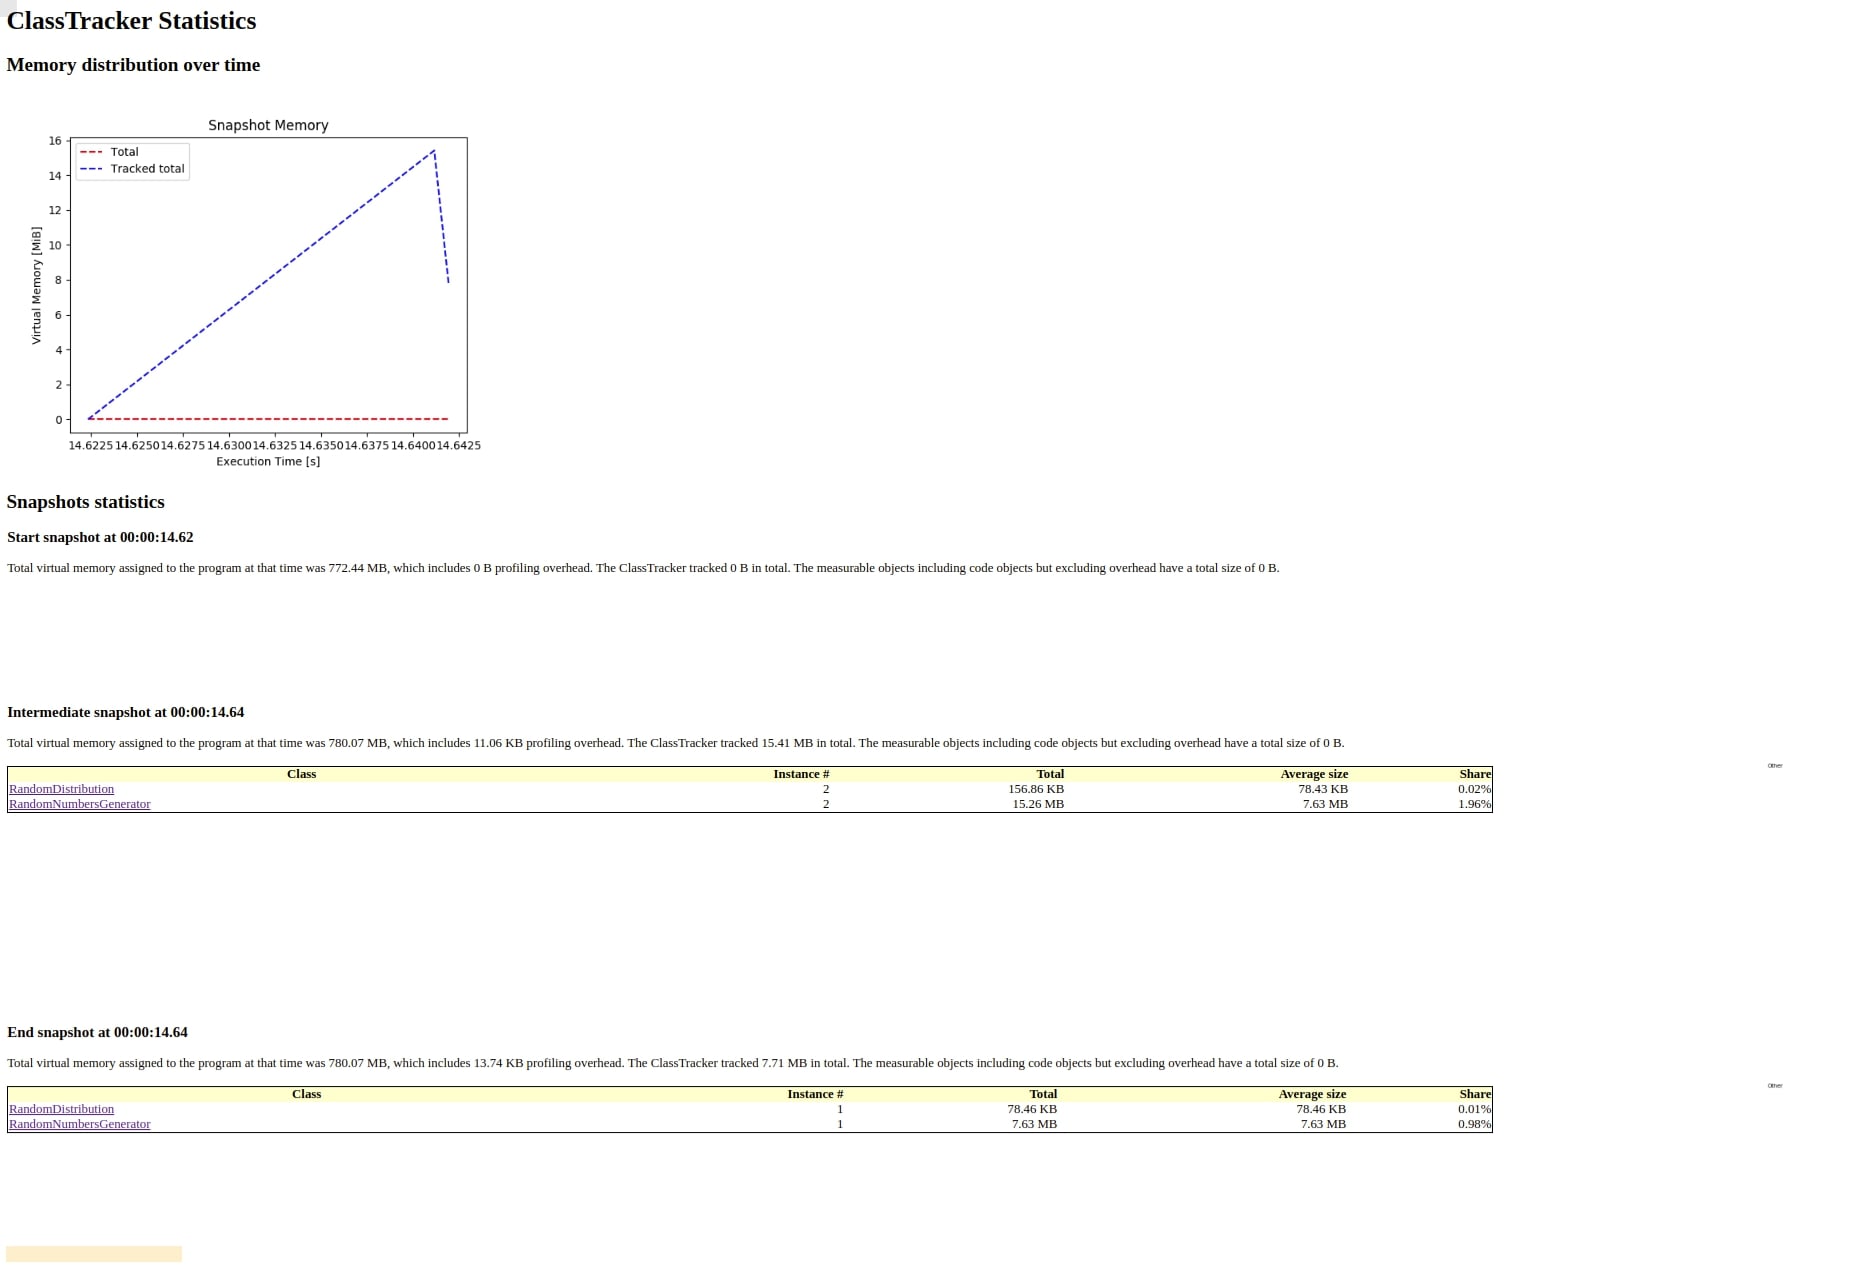
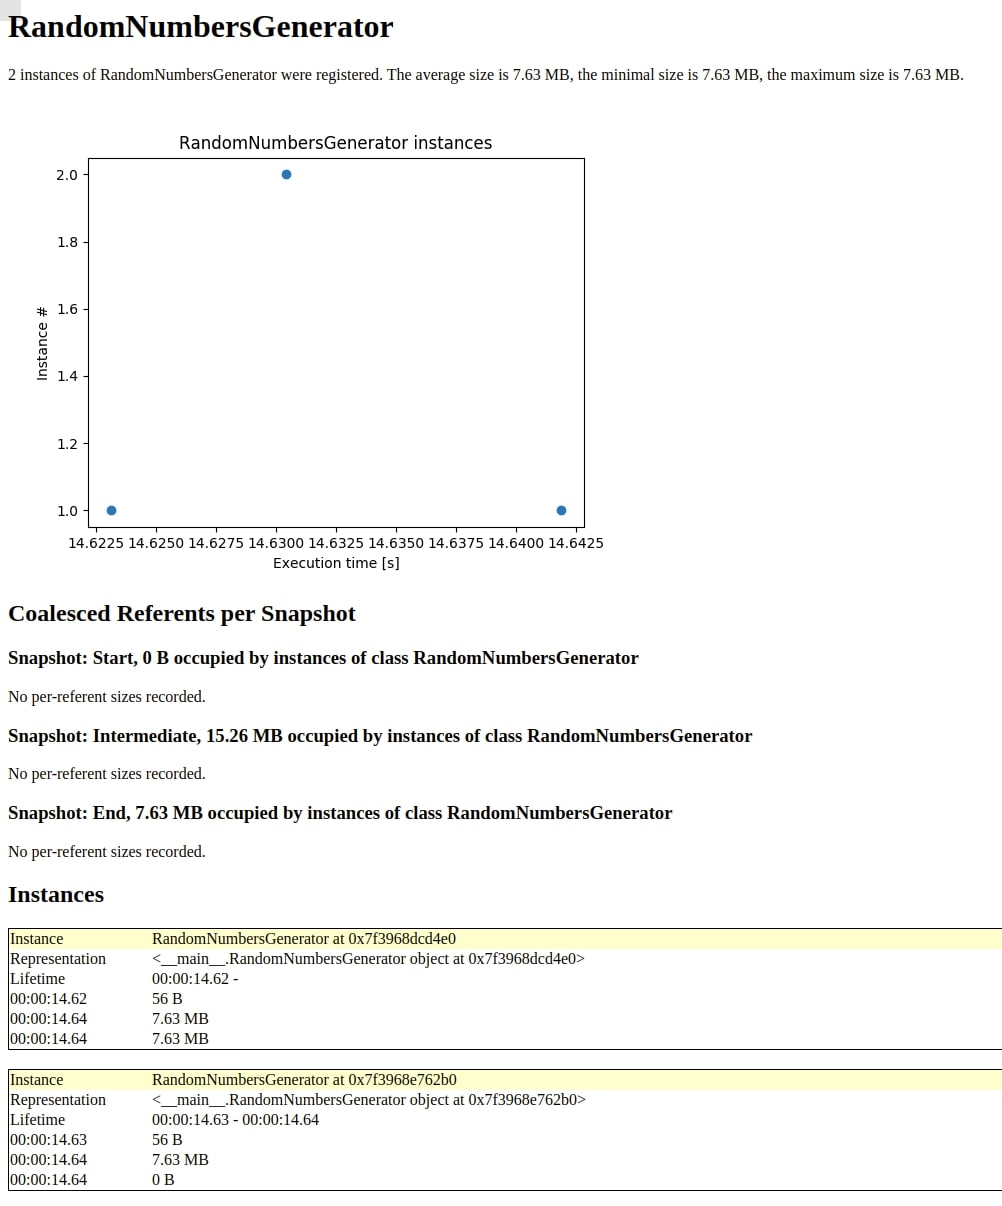
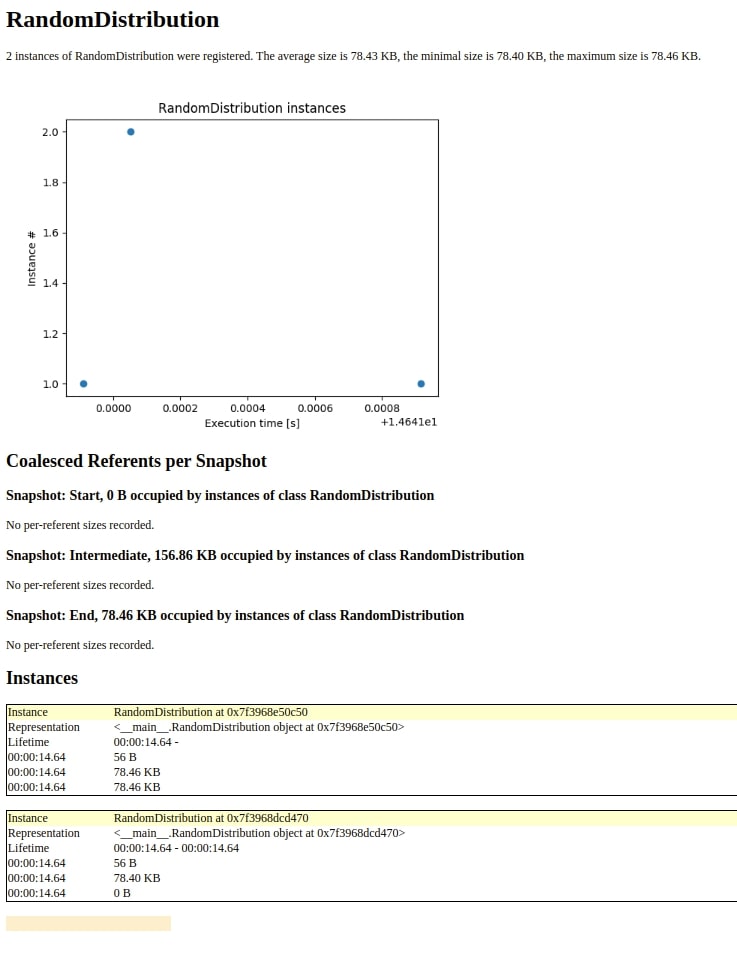
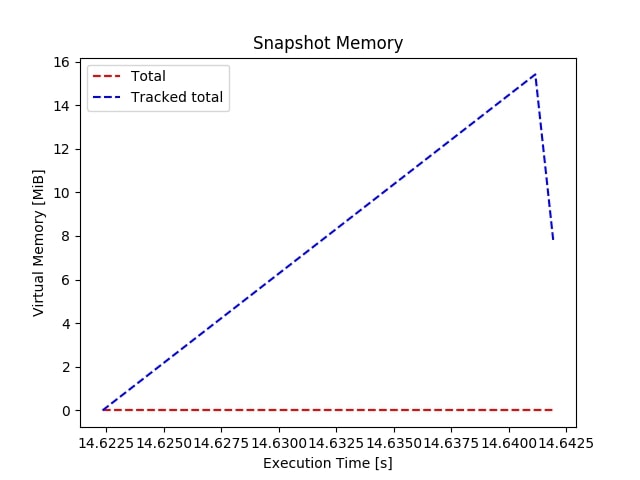
As a part of this example, we have explained how we can format monitoring statistics as an HTML file which has charts explaining memory usage of a class.
- classtracker_stats.HtmlStats() - This class takes as input class tracker instance and will be responsible for formatting monitoring stats as html.
Below we have again recreated an example almost the same as one of our previous examples but this time introduced HTML stats as well.
from pympler import classtracker, classtracker_stats

ct = classtracker.ClassTracker()
ct.track_class(RandomNumbersGenerator, name=RandomNumbersGenerator.__name__)
ct.track_class(RandomDistribution, name=RandomDistribution.__name__)

html_stats = classtracker_stats.HtmlStats(ct)

ct.create_snapshot(description="Start")

rand1 = RandomNumbersGenerator((1000,1000))
rand2 = RandomNumbersGenerator((1000,1000))

unif_dist1 = RandomDistribution((100,100))
unif_dist2 = RandomDistribution((100,100))

ct.create_snapshot(description="Intermediate")

#ct.stats.print_stats()
del rand2, unif_dist2

ct.create_snapshot(description="End")

ct.stats.print_summary()

html_stats.dump_stats("pympler_html_stats.out")
print("Tracked Classes : ",html_stats.tracked_classes)

ct.close()
- HtmlStats.create_html() - This method will create HTML file of monitoring stats. It'll also create supporting folder of files with the same name as HTML file name.
html_stats.create_html("html_stats.html")
Other Files
Example 7
As a part of our seventh example, we are explaining how we can inform class tracker to take snapshots periodically rather than we manually taking snapshot each time.
- classtracker.PeriodicThread() - This class takes as input class tracker instance and interval in seconds. It'll then take snapshots as that interval.
- PeriodicThread.tracker.stop_periodic_snapshots() - We can call this method to inform periodic thread to stop taking snapshots.
- PeriodicThread.tracker.start_periodic_snapshots() - We can call this method to inform periodic thread to start taking snapshots.
Below we have explained the usage of the above methods with a simple example.
import time

ct = classtracker.ClassTracker()
ct.track_class(RandomNumbersGenerator, name=RandomNumbersGenerator.__name__)
ct.track_class(RandomDistribution, name=RandomDistribution.__name__)

periodic_thread = classtracker.PeriodicThread(ct, 0.1)
periodic_thread.start()

rand1 = RandomNumbersGenerator((1000,1000))
unif_dist1 = RandomDistribution((100,100))
ct.stats.print_summary()

periodic_thread.tracker.stop_periodic_snapshots()

rand2 = RandomNumbersGenerator((1000,1000))
unif_dist2 = RandomDistribution((100,100))

ct.stats.print_summary()

periodic_thread.tracker.start_periodic_snapshots()

ct.stats.print_summary()

ct.close()
tracker
The tracker module lets us monitor overall memory usage over time. It can let us track the difference in memory usage between summaries.
from pympler import tracker
- tracker.SummaryTracker() - This class lets us monitor memory usage between summaries.
- SummaryTracker.create_summary() - This method creates a memory usage summary.
- SummaryTracker.print_diff() - This method finds out difference between two summaries.
- diff() - This method returns difference between two summaries as a list.
Below we have explained the usage of methods with a simple example.
summary_tracker = tracker.SummaryTracker()
summary_tracker.print_diff()
s0 = summary_tracker.create_summary()
l = [i*i for i in range(10000)] ## Creating Temporary List to Check its presence in difference
s1 = summary_tracker.create_summary()

summary_tracker.print_diff(summary1=s0, summary2=s1)
sorted(summary_tracker.diff(summary1=s0, summary2=s1), key=lambda x: x[2], reverse=True)
muppy
The muppy module lets the developer detect memory leaks. As a part of this section, we'll explain the usage of various methods of muppy module.
from pympler import muppy
- muppy.get_objects() - It returns list of all objects in the memory.
objs = muppy.get_objects()
print("Number of Objects : ", len(objs))
- muppy.filter() - It lets us filter objects passed to it to keep only objects of a particular type.
Below we have only kept objects of type list.
objs_by_type = muppy.filter(objs, Type=list)
objs_by_type[:5]
- muppy.get_referents() - It lets us find objects referring to object passed to it.
l = [i*i for i in range(4999)]

all_objs_referred_by_l = muppy.get_referents(l)

print("Number of Objects Referred by List l : ", len(all_objs_referred_by_l))
- muppy.print_summary() - It prints memory usage as table.
muppy.print_summary()
- muppy.getsizeof() - It returns size of object as bytes.
l = [i*i for i in range(10000)]
print("Size of List l : %d bytes"%muppy.getsizeof(l))
garbagegraph
This module lets us monitor cyclic objects. It has a class named GarbageGraph which takes an input list of objects and generates graphviz visualization showing the relation between them which can help us detect a cycle. The GarbageGraph is an extension of ReferenceGraph which will introduce in the refgraph section.
Below we have tried to create cyclic objects and then created a garbage graph of it.
from pympler import garbagegraph
a = "A"
b = True
c = {a:b}
d= [1,2,3]
e = {2:3}

ref_graph = garbagegraph.GarbageGraph([a,b,c, d, e])
- GarbageGraph.write_graph() - It saves reference graph to an output file.
- GarbageGraph.render() - It renders graph created using
write_graph()method as graphviz graph with.psextension.
ref_graph.write_graph("ref_graph.out")
!cat ref_graph.out
ref_graph.render("ref_graph1.out")
refbrowser
The refbrowser module lets us print tree-like illustration for object referrers. Below we have created a tree-like exploration of objects using ConsoleBrowser and FileBrowser classes of the refbrowser module.
from pympler import refbrowser
a = "A"
b = "B"
c = [a, b]

browser = refbrowser.ConsoleBrowser(b)

browser.print_tree()
str-+-list--dict-+-dict
    |            +-module(__main__)
    |            +-dict
    |            +-dict
    |
    +-frozenset--dict-+-module(sre_parse)
    |                 +-function (_class_escape)
    |                 +-function (_escape)
    |                 +-function (_uniq)
    |                 +-function (_parse_sub)
    |                 +-function (_parse)
    |                 +-function (_parse_flag
file_browser = refbrowser.FileBrowser(b)
file_browser.print_tree("tree.out")
str-+-list--dict-+-dict
    |            +-module(__main__)
    |            +-dict
    |            +-dict
    |
    +-frozenset--dict-+-module(sre_parse)
    |                 +-function (_class_escape)
    |                 +-function (_escape)
    |                 +-function (_uniq)
    |                 +-function (_parse_sub)
    |                 +-function (_parse)
    |                 +-function (_parse_flag
refgraph
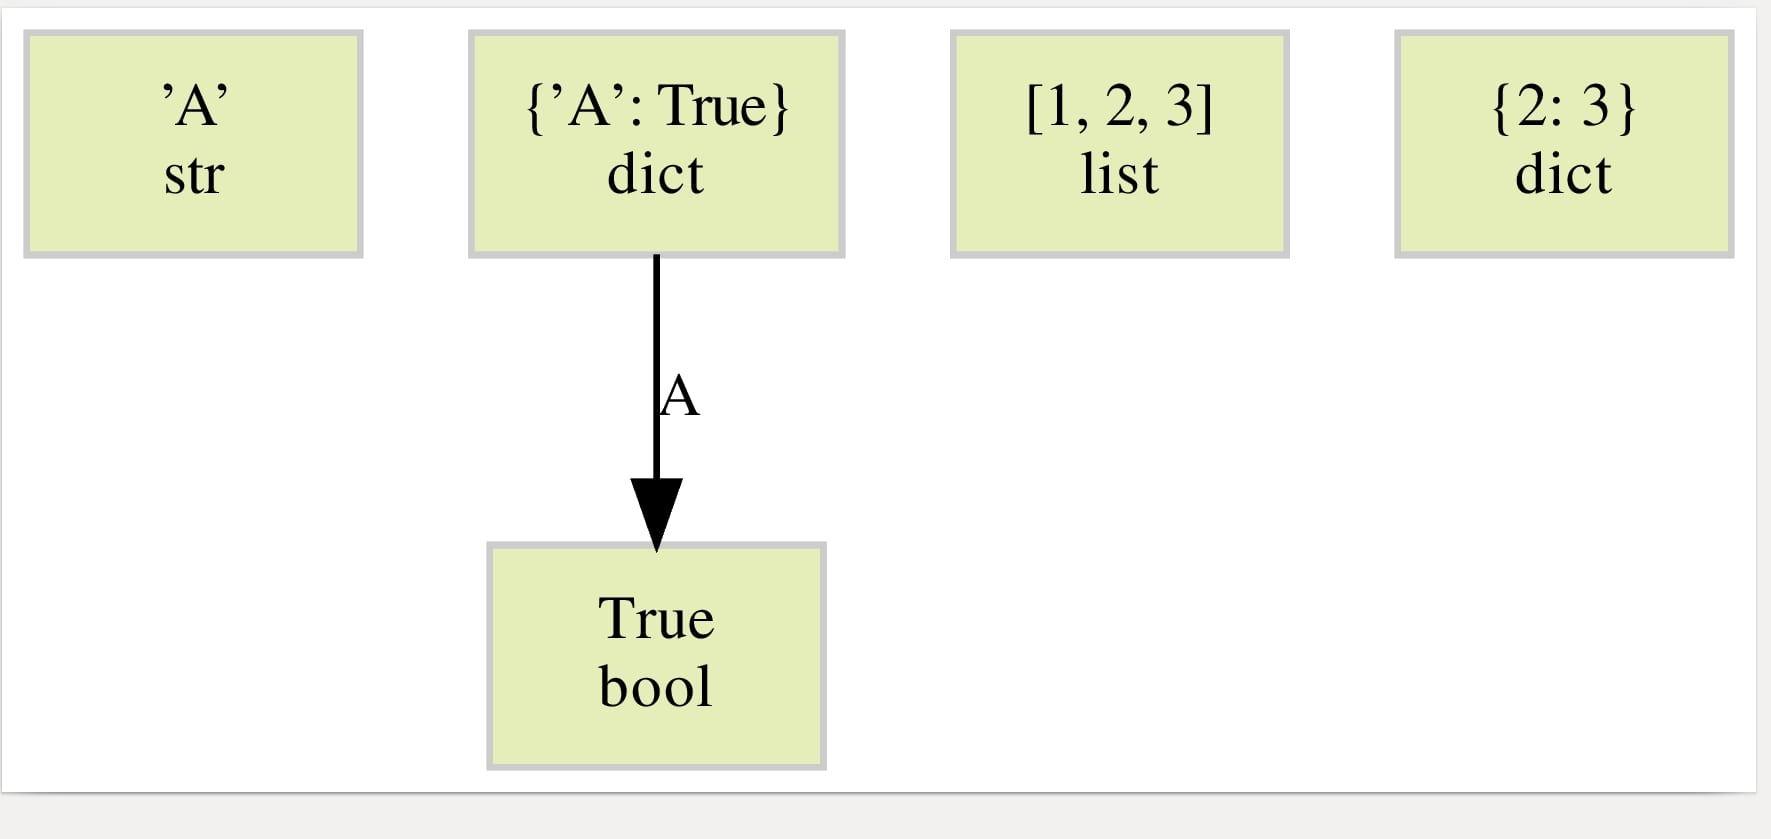
The refgraph module creates a graphviz graph of references.
- refgraph.ReferenceGraph() - It takes as an input list of objects and then creates a reference graph showing the relation between them.
- ReferenceGraph.write_graph() - It saves reference graph to an output file.
- ReferenceGraph.render() - It renders graph created using
write_graph()method as graphviz graph with.psextension.
Below we have created reference graph of a few objects and then also created a graphviz directed graph of it.
from pympler import refgraph
a = "A"
b = True
c = {a:b}
d= [1,2,3]
e = {2:3}

ref_graph = refgraph.ReferenceGraph([a,b,c, d, e])
ref_graph.write_graph("ref_graph_graphviz")
!cat ref_graph.out
ref_graph.render("ref_graph_graphviz")
summary
The summary module lets us create a summary of the list of objects.
- summary.summarize() - It creates summary for list of objects as a table.
- summary.print_() - This method prints output of
summarize()method in a table format. - summary.get_diff() - It lets us find out two different types of summary generated by
summarize()method.
Below we have explained the usage of these methods with simple examples.
from pympler import summary
sum_by_type = summary.summarize(objs_by_type)

summary.print_(sum_by_type)
sum_by_l = summary.summarize(all_objs_referred_by_l)

summary.print_(sum_by_l)
sum_full = summary.summarize(objs)

summary.print_(sum_full)
diff = summary.get_diff(sum_by_type, sum_full)
summary.print_(diff)
This ends our small tutorial explaining various modules and methods available with pympler. Please feel free to let us know your views in the comments section.
References
- How to Profile Python Code using cProfile and Profile
- line_profiler: Line by Line Profiling of Python Code
- How to Profile Memory Usage in Python using memory_profiler
- Snakeviz - Visualize Profiling Results in Python
- pprofile - Deterministic and Statistical Profiler for Python Code
- guppy/heapy - Profile Memory Usage in Python
- Scalene - CPU and Memory Profiler for Python Code
- py-spy - Sampling Profiler for Python Code
- pyinstrument - Statistical Profiler for Python Code
- yappi - Yet Another Python Profiler
- tracemalloc - How to trace memory usage in Python code
 Sunny Solanki
Sunny Solanki
Intro: Software Developer | Youtuber | Bonsai Enthusiast
About: Sunny Solanki holds a bachelor's degree in Information Technology (2006-2010) from L.D. College of Engineering. Post completion of his graduation, he has 8.5+ years of experience (2011-2019) in the IT Industry (TCS). His IT experience involves working on Python & Java Projects with US/Canada banking clients. Since 2020, he’s primarily concentrating on growing CoderzColumn.
His main areas of interest are AI, Machine Learning, Data Visualization, and Concurrent Programming. He has good hands-on with Python and its ecosystem libraries.
Apart from his tech life, he prefers reading biographies and autobiographies. And yes, he spends his leisure time taking care of his plants and a few pre-Bonsai trees.
Contact: sunny.2309@yahoo.in


![YouTube Subscribe]() Comfortable Learning through Video Tutorials?
Comfortable Learning through Video Tutorials?
If you are more comfortable learning through video tutorials then we would recommend that you subscribe to our YouTube channel.
![Need Help]() Stuck Somewhere? Need Help with Coding? Have Doubts About the Topic/Code?
Stuck Somewhere? Need Help with Coding? Have Doubts About the Topic/Code?
 Stuck Somewhere? Need Help with Coding? Have Doubts About the Topic/Code?
When going through coding examples, it's quite common to have doubts and errors.
If you have doubts about some code examples or are stuck somewhere when trying our code, send us an email at coderzcolumn07@gmail.com. We'll help you or point you in the direction where you can find a solution to your problem.
You can even send us a mail if you are trying something new and need guidance regarding coding. We'll try to respond as soon as possible.
![Share Views]() Want to Share Your Views? Have Any Suggestions?
Want to Share Your Views? Have Any Suggestions?
 Want to Share Your Views? Have Any Suggestions?
If you want to
- provide some suggestions on topic
- share your views
- include some details in tutorial
- suggest some new topics on which we should create tutorials/blogs
 memory-profiling