Bokeh - How to Layout Charts to Create Figure?
Bokeh is the most commonly used interactive data visualization library in python when working in jupyter notebooks. It's based on javascript and provides easy to use interface to create interactive charts using python. We have already covered a tutorial on creating simple charts using bokeh. We also have covered detailed tutorial explaining various ways to decorate bokeh graphs by using various styling and annotation attributes available. We suggest that you go through those tutorials if you wanted to get started with bokeh from the beginning.
As a part of this tutorial, we'll be covering various ways to layout bokeh charts to create figure combining analysis on a particular topic.
Bokeh module bokeh.layouts provides various ways to layout charts in order to create images. Below we have listed down layouts that we'll be explaining as a part of this tutorial:
- row - It lays out all charts in a single row.
- column - It lays out all charts in a single column.
- gridplot - It lays out charts in a grid fashion.
- layout - It lays out all charts passed to it in the best possible way.
We'll start by importing necessary libraries.
from bokeh.io import output_notebook, show
from bokeh.plotting import figure
from bokeh.resources import INLINE
output_notebook(resources=INLINE)

We'll be generating various charts using the autompg dataset that is readily available with bokeh.
- autompg - It holds information about various cars along with their attributes like mpg, horsepower, weight, acceleration, year, origin, etc.
Bokeh provides this dataset as a part of the sampledata module as a pandas dataframe.
from bokeh.sampledata.autompg import autompg
from bokeh.sampledata.iris import flowers
autompg.head()
We'll now go through each layout by creating various charts using the above datasets and lining them using the layout.
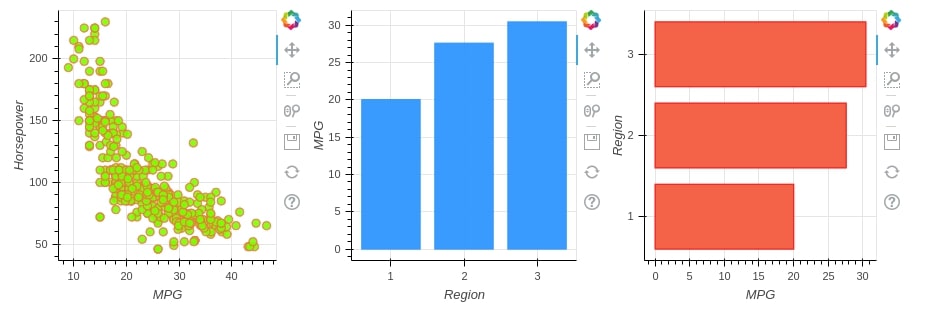
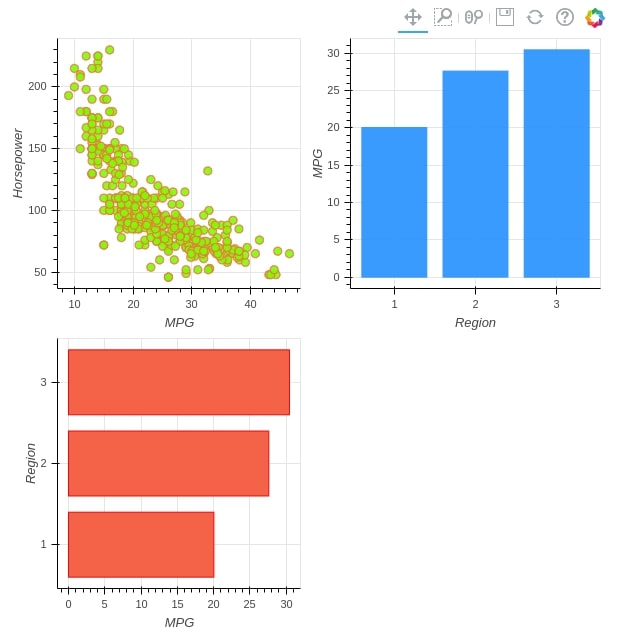
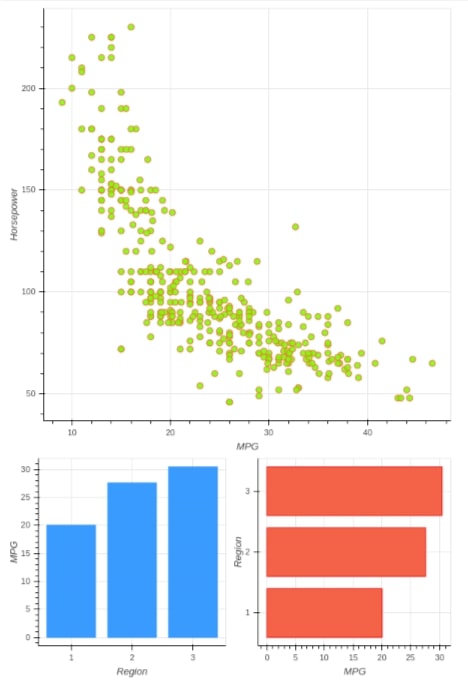
Row Layout
The Row layout as its name suggests let us organize all charts in a row. The bokeh.layouts module provides a method named row() which accepts a list of charts as input and plots all of them in a row. We have explained below its usage with a simple example.
from bokeh.layouts import row

## Chart 1 -  Scatter Plot
chart1 = figure(width=300, height=300)
chart1.circle(
              x=autompg["mpg"], y=autompg["hp"],
              size=8, alpha=0.9,
              fill_color="lawngreen", line_color="tomato"
            )
chart1.xaxis.axis_label="MPG"
chart1.yaxis.axis_label="Horsepower"

## Chart 2 - Bar Chart
autompg_avg_by_origin = autompg.groupby(by="origin").mean()

chart2 = figure(width=300, height=300)
chart2.vbar(
             x = [1,2,3],
             width=0.8,
             top=autompg_avg_by_origin.mpg,
             fill_color="dodgerblue", line_color="dodgerblue", alpha=0.9
           )
chart2.xaxis.axis_label="Region"
chart2.yaxis.axis_label="MPG"
chart2.xaxis.ticker = [1, 2, 3]

## Chart 3 - Horizontal Bar Chart
chart3 = figure(width=300, height=300)
chart3.hbar(
             y = [1,2,3],
             height=0.8,
             right=autompg_avg_by_origin.mpg,
             fill_color="tomato", line_color="red")

chart3.xaxis.axis_label="MPG"
chart3.yaxis.axis_label="Region"
chart3.yaxis.ticker = [1, 2, 3]

show(row(chart1, chart2, chart3))
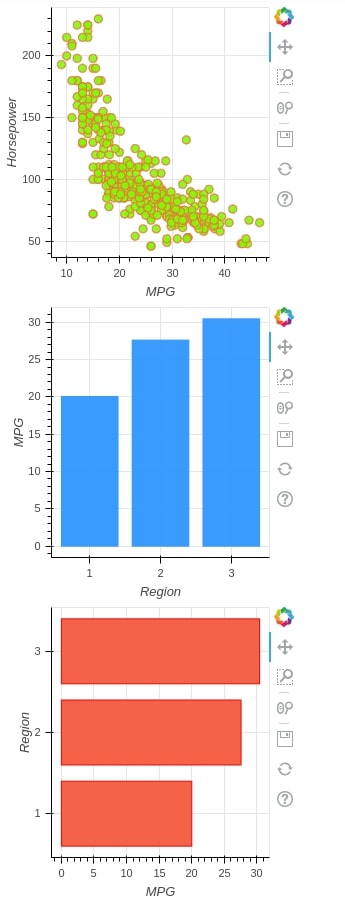
Column Layout
The column layout lets us organize charts in a column-wise fashion. The bokeh.layouts module provides a method named column() which accepts a list of charts as input and plots all of them in a single column. We have used the same 3 charts from the previous example and have organized them as a column.
from bokeh.layouts import column

show(column(chart1, chart2, chart3))
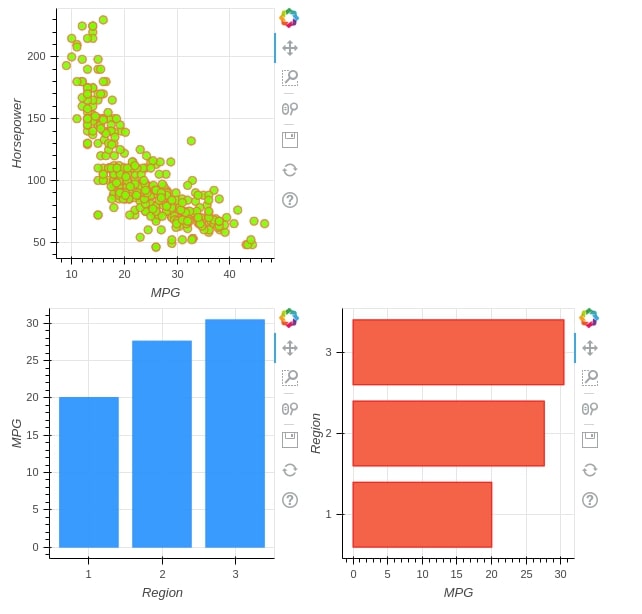
We can even combine row and column layouts by giving each of them as an argument to another to create a complicated layout according to our choice. Below we are creating row layout of chart2 and chart3 and then passing it as 2nd chart to column layout method.
show(column(chart1 , row(chart2, chart3)))
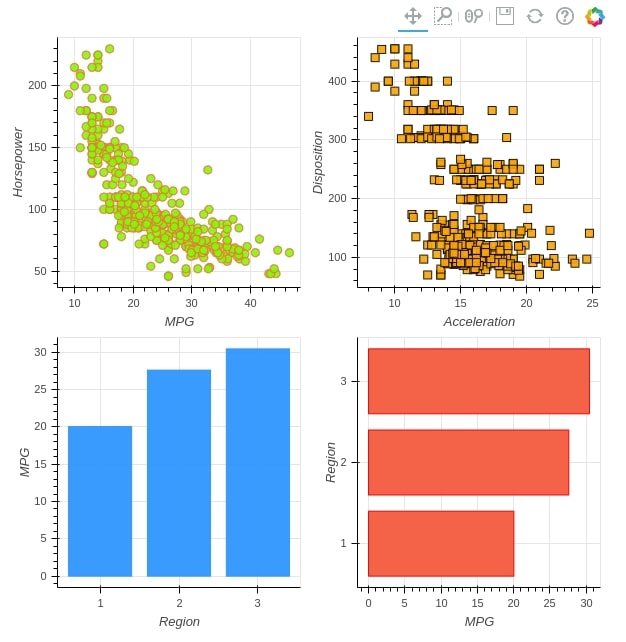
Grid Layout
The grid layout lets us organize things in the NxN grid. The bokeh.layouts module provides 2 method named gridplot() and grid() for creating grid layout in bokeh. It accepts lists of a list containing charts as input. We can omit cells of the NxN grid where we don't want to include a chart. We can even stretch charts to more than one cell of the grid.
Below we have created a 2x2 grid of charts where we are passing None for the first chart of cell and we can see a gap in the result.
from bokeh.layouts import gridplot

grid_layout = gridplot([[None, chart1], [chart2, chart3]], plot_width=300, plot_height=300)

show(grid_layout)
We can also pass all charts as a single list and then enforce a number of columns using the ncols attribute of the gridplot() method.
grid_layout = gridplot([chart1,chart2, chart3], ncols=2)

show(grid_layout)
We have below added one more chart to layout and filled all cells of the 2x2 grid.
chart4 = figure(width=300, height=300)
chart4.square(
              x=autompg["accel"], y=autompg["displ"],
              size=8, alpha=0.9,
              fill_color="orange", line_color="black"
            )
chart4.xaxis.axis_label="Acceleration"
chart4.yaxis.axis_label="Disposition"

grid_layout = gridplot([[chart1, chart4], [chart2, chart3]], plot_width=300, plot_height=300)

show(grid_layout)
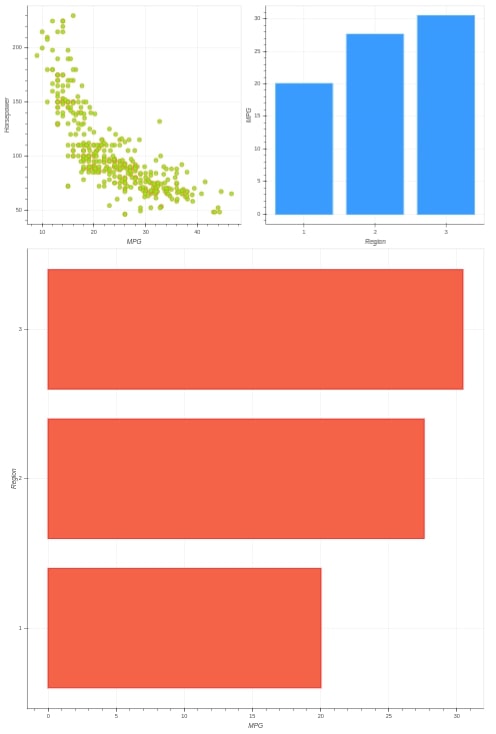
The grid() method works exactly like gridplot(). It stretches all charts if we do not provide a chart for any cell of the grid. It also stretches charts to the full length of the screen.
Both grid() and gridplot()provides sizing_mode attribute to handle charts with different sizes by scaling or stretching them to make layout look good. It accepts one of the below values:
- fixed
- stretch_both
- scale_both
- scale_height
- scale_width
from bokeh.layouts import grid

grid_layout = grid([[chart1],[chart2, chart3]])

show(grid_layout)
The grid() method provides nrows and ncols attributes which can let us force the MxN grid layout on charts passed as list.
grid_layout = grid([chart1,chart2, chart3], nrows=2)

show(grid_layout)
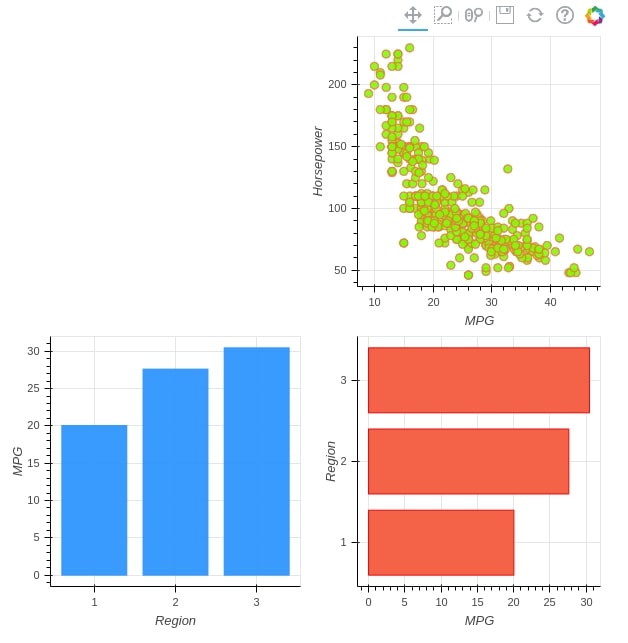
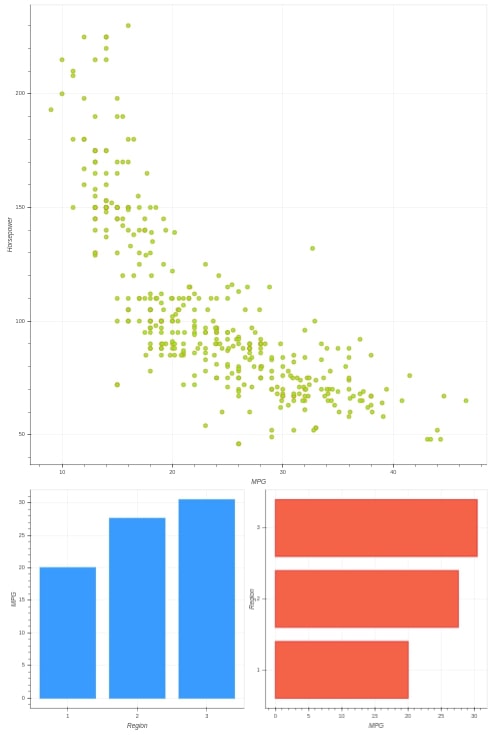
Custom Layout
The last layout available through the bokeh is a custom layout. It accepts a list of list of charts as input and lays out each list of charts in a single row. The bokeh.layouts module provides layout() method for this. It accepts a list of list of charts as the first input. This lets us organize things according to our needs.
We can use it's sizing_mode attributes to handle charts with different sizes by scaling or stretching them to make the layout look good.
from bokeh.layouts import layout

figure_layout = layout([chart1, [chart2, chart3]], sizing_mode="scale_height")

show(figure_layout)
This ends our small tutorial explaining various layouts available with bokeh and how to use them to generate figures with multiple charts. Please feel free to let us know your views in the comments section.
References
 Sunny Solanki
Sunny Solanki
Intro: Software Developer | Youtuber | Bonsai Enthusiast
About: Sunny Solanki holds a bachelor's degree in Information Technology (2006-2010) from L.D. College of Engineering. Post completion of his graduation, he has 8.5+ years of experience (2011-2019) in the IT Industry (TCS). His IT experience involves working on Python & Java Projects with US/Canada banking clients. Since 2020, he’s primarily concentrating on growing CoderzColumn.
His main areas of interest are AI, Machine Learning, Data Visualization, and Concurrent Programming. He has good hands-on with Python and its ecosystem libraries.
Apart from his tech life, he prefers reading biographies and autobiographies. And yes, he spends his leisure time taking care of his plants and a few pre-Bonsai trees.
Contact: sunny.2309@yahoo.in


![YouTube Subscribe]() Comfortable Learning through Video Tutorials?
Comfortable Learning through Video Tutorials?
If you are more comfortable learning through video tutorials then we would recommend that you subscribe to our YouTube channel.
![Need Help]() Stuck Somewhere? Need Help with Coding? Have Doubts About the Topic/Code?
Stuck Somewhere? Need Help with Coding? Have Doubts About the Topic/Code?
 Stuck Somewhere? Need Help with Coding? Have Doubts About the Topic/Code?
When going through coding examples, it's quite common to have doubts and errors.
If you have doubts about some code examples or are stuck somewhere when trying our code, send us an email at coderzcolumn07@gmail.com. We'll help you or point you in the direction where you can find a solution to your problem.
You can even send us a mail if you are trying something new and need guidance regarding coding. We'll try to respond as soon as possible.
![Share Views]() Want to Share Your Views? Have Any Suggestions?
Want to Share Your Views? Have Any Suggestions?
 Want to Share Your Views? Have Any Suggestions?
If you want to
- provide some suggestions on topic
- share your views
- include some details in tutorial
- suggest some new topics on which we should create tutorials/blogs
 data-visualizaton, bokeh