Network Analysis in Python: Important Structures and Bipartite Graphs [Networkx]
Table of Contents
- Introduction
- 1. Load Dataset
- 2. Create a Graph
- 3. Visualize Graph
- 4. Structures in a Graph
- 5. Bipartite Graphs
- References
Introduction 
Network analysis helps us get meaningful insights into graph data structures. We already discussed network structure and it's basic analysis in our other tutorial titled "Network Analysis: Node Importance & Paths". We have explained about basic network structure and network creation as well as manipulation using python library networkx. This tutorial is a continuation of that tutorial on further analysis of graph data structures. As a part of this tutorial, we'll be taking a look at presence important structures like cliques, triangles, connected components. We'll also explain the bipartite graph. If you do not have a background about network terminology and networkx library then we suggest that you go through our tutorials on basic network analysis and networkx basics.
To get started with the analysis, we'll define the graph data structure first. Graphs are data structure which has two main entities:
- Nodes/Vertices: It's used to represent entities like airports, people, recipe ingredients, etc
- Edges: It's used to represent a relationship between nodes like the distance between airports, the relation between people, whether an ingredient is part of a recipe, etc. Edges are the most important properties of graphs.
Graphs are generally represented as G(V, E) where V represents a list of vertices/nodes, and E represents a list of edges between those nodes. When representing graphs as visually each node is represented as a circle and each edge is shown as a line connecting nodes labeling relation between that nodes.
We'll start importing all necessary libraries which will be used as a part of this tutorial.
import pandas as pd
import numpy as np

import networkx as nx

import matplotlib.pyplot as plt

import sys
import warnings
warnings.filterwarnings('ignore')

print('Python Version : '+sys.version)
print('NetworkX version : '+nx.__version__)

%matplotlib inline
1. Load Dataset 
We'll start loading the dataset that we'll be using for our tutorial. We'll be using physician trust dataset available from Konect.
The dataset has information about the network which captures innovation spread among 246 physicians from Illinois, Peoria, Bloomington, Quincy, and Galesburg collected in 1966. The node in a graph presents physician and edge represent that left physician will contact the right physician for advice or discussion hence trusting that physician.
We'll load this dataset and create a graph out of it. We suggest that you download the dataset as well to follow along with us.
df = pd.read_csv('datasets/moreno_innovation/out.moreno_innovation_innovation', sep=' ', skiprows=2, header=None)
df.columns = ['doctor1', 'doctor2']
df.head()
2. Create a Graph 
We'll be creating a directed graph using the networkx package. We'll loop through each entry of the dataset and add an edge to a network suggesting the first physician will interact with the second physician. We do not have any metadata present as a part of this dataset to be added to the network. We'll be printing the first few nodes and edges once the graph is created.
undirected_G = nx.Graph()

for idx in df.index:
    undirected_G.add_edge(df.loc[idx]['doctor1'], df.loc[idx]['doctor2'])
list(undirected_G.nodes(data=True))[:5]
list(undirected_G.edges(data=True))[:5]
3. Visualize Graph 
We'll now try to visualize graphs using various network graph plots available like networkx plot, circos plot, arc plot, and matrix plot.
3.1 Networkx Plot 
nx.draw(undirected_G, font_color="red", node_color="lime", with_labels=True, edge_size=10)
![Network Analysis in Python: Important Structures and Bipartite Graphs [Networkx]](/static/tutorials/data_science/network-analysis-bipartite-1.jpg)
From above networkx hairball, we can see that the dataset seems to be consist of 4 different graphs.
3.2 Circos Plot 
from nxviz import CircosPlot

c = CircosPlot(undirected_G)
c.draw()
![Network Analysis in Python: Important Structures and Bipartite Graphs [Networkx]](/static/tutorials/data_science/network-analysis-bipartite-2.jpg)
By looking at the above circos plot it seems like there are different independent networks present in a dataset.
3.3 Arc Plot 
from nxviz import ArcPlot

a = ArcPlot(undirected_G, figsize=(12,5))
a.draw()
plt.tight_layout()
plt. autoscale()
![Network Analysis in Python: Important Structures and Bipartite Graphs [Networkx]](/static/tutorials/data_science/network-analysis-bipartite-3.jpg)
The above arc chart also confirms further that the dataset seems to consist of 4 different networks.
3.4 Matrix Plot [Adjacency Matrix] 
from nxviz import MatrixPlot

m = MatrixPlot(undirected_G)
m.draw()
![Network Analysis in Python: Important Structures and Bipartite Graphs [Networkx]](/static/tutorials/data_science/network-analysis-bipartite-4.jpg)
The above matrix plot of the graph adjacency matrix represents the same findings are previous plots.
4. Structures in a Graph 
We'll now try to identify various structures available in the graph. We'll look for cliques, triangles, connected components present in graphs.
4.1 Cliques & Triangles 
In a network, a clique is a group of nodes that are closely connected with one another. It's a data structure where each node is connected to all other nodes of that data structure hence knows everybody else.
The single edge is the simplest clique where both nodes are connected to each other. The triangles are another simplest type of clique where there are three nodes and each node is connected to the other two nodes.
Networkx API provides a method called find_cliques() which returns all possible cliques. We'll use it to get cliques of different sizes.
cliques = list(nx.find_cliques(undirected_G))
trianlges = [clique for clique in cliques if len(clique) == 3]

print("Number of Triangles Available : ", len(trianlges))
print("First Few Triangles : ", trianlges[:5])
nx.draw(undirected_G.subgraph(trianlges[0]), with_labels=True, node_color="lime", font_color="red")
![Network Analysis in Python: Important Structures and Bipartite Graphs [Networkx]](/static/tutorials/data_science/network-analysis-bipartite-5.jpg)
cliques_of_len_4 = [clique for clique in cliques if len(clique) == 4]

print("Available Number of Cliques of Length 4 : ", len(cliques_of_len_4))
print("First Few Cliques of Length 4 : ", cliques_of_len_4[:4])
nx.draw(undirected_G.subgraph(cliques_of_len_4[0]), with_labels=True, node_color="lime", font_color="red")
![Network Analysis in Python: Important Structures and Bipartite Graphs [Networkx]](/static/tutorials/data_science/network-analysis-bipartite-6.jpg)
cliques_of_len_5 = [clique for clique in cliques if len(clique) == 5]

print("Available Number of Cliques of Length 4 : ", len(cliques_of_len_5))
print("First Few Cliques of Length 4 : ", cliques_of_len_5[:4])
nx.draw(undirected_G.subgraph(cliques_of_len_5[0]), with_labels=True, node_color="lime", font_color="red")
![Network Analysis in Python: Important Structures and Bipartite Graphs [Networkx]](/static/tutorials/data_science/network-analysis-bipartite-7.jpg)
4.2 Connected Components 
Connected components of the graph are subgraphs where each node is reachable from another node by following some path. It'll be reachable directly or by following a few other nodes but one can travel from one node to another without break.
These components are not connected to other nodes of the graph. When we first plotted above network through circos plot, arc plot, networkx plot, and matrix plot; we noticed that this network of physicians seems to consist of other independent small networks.
Networkx provides us with methods named connected_component_subgraphs() and connected_components() for generating list of connected components present in graph. We can pass the original graph to them and it'll return a list of connected components as a subgraph. We'll below retrieve all subgraphs from the original network and try to plot them to better understand them.
connected_components = list(nx.connected_component_subgraphs(undirected_G))
connected_components
Below we are using connected_components() for generating list of connected components. It returns a list where each entry is a list itself of nodes comprising connected components. We'll loop through each list entry and convert it to subgraph using Graph.subgraph() method. It'll result in the same output as the output of the above method.
connected_components2 = [undirected_G.subgraph(nodes) for nodes in list(nx.connected_components(undirected_G))]
connected_components2
4.3 Plotting Individual Connected Components as Networkx Graph 
plt.figure(figsize=(15,6))

plt.subplot(141)
nx.draw(connected_components[0], with_labels=True, node_color="lime", font_color="red")

plt.subplot(142)
nx.draw(connected_components[1], with_labels=True, node_color="lime", font_color="red")

plt.subplot(143)
nx.draw(connected_components[2], with_labels=True, node_color="lime", font_color="red")

plt.subplot(144)
nx.draw(connected_components[3], with_labels=True, node_color="lime", font_color="red")
![Network Analysis in Python: Important Structures and Bipartite Graphs [Networkx]](/static/tutorials/data_science/network-analysis-bipartite-8.jpg)
4.4 Adding Connected Components Index as Metadata to Nodes & Visualizing Graph 
We'll now add connected components index as metadata to each node of the original graph. We'll then visualize the modified graph using the circos plot to properly highlight each individual connected component.
## Logic to add nodes metadata
for i, subgraph in enumerate(connected_components):
    for n in subgraph.nodes():
        undirected_G.node[n]['component_idx'] = i
        undirected_G.node[n]['node_size'] = (i+1)*10
        undirected_G.node[n]['node_label'] = "%d"%(i+1)

## Logic to add edges metadata
for i, subgraph in enumerate(connected_components):
    for start, end in subgraph.edges():
        undirected_G.edges[start, end]['component_idx'] = i
        undirected_G.edges[start, end]['edge_width'] = i+1
circos = CircosPlot(undirected_G,
                   node_color='component_idx', node_order='component_idx',
                   edge_color="component_idx", edge_width='edge_width',
                   node_cmap="Dark2",
                   )
circos.draw()
![Network Analysis in Python: Important Structures and Bipartite Graphs [Networkx]](/static/tutorials/data_science/network-analysis-bipartite-9.jpg)
arc = ArcPlot(undirected_G,
                node_color='component_idx', node_order='component_idx',
                edge_color="component_idx", edge_width='edge_width',
                figsize=(10,6))
arc.draw()
plt.tight_layout()
plt. autoscale()
![Network Analysis in Python: Important Structures and Bipartite Graphs [Networkx]](/static/tutorials/data_science/network-analysis-bipartite-10.jpg)
We can notice from the above circos plot that each individual component is highlighted using different colors.
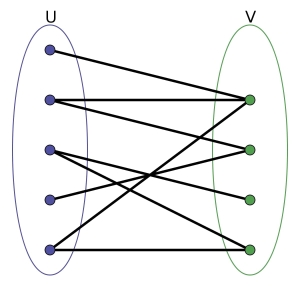
5. Bipartite Graphs 
Bipartite graphs (bi-two, partite-partition) are special cases of graphs where there are two sets of nodes as its name suggests. The node from one set can only connect to nodes from another set. The nodes from one set can not interconnect. It can be used to model a relationship between two different sets of points.
The real-life examples of bipartite graphs are person-crime relationship, recipe-ingredients relationship, company-customer relationship, etc.
We'll be loading crime data available from konect to understand bipartite graphs.
5.1 Load Dataset 
The dataset consists of three files. The first file has information from person id to crime id relation. The second file has information about the type of crime based on the index of the first file. The third file has information about the gender of a person based on the index of the first file. We'll load all files as a pandas dataframe and display the first few rows below to get an idea about the contents of files.
df = pd.read_csv('datasets/moreno_crime/out.moreno_crime_crime', sep=' ', skiprows=2, names= ["PersonID", "CrimeID", "NAN"])
df = df[['PersonID', 'CrimeID']]
df.head()
roles = pd.read_csv('datasets/moreno_crime/rel.moreno_crime_crime.person.role', header=None)
roles.columns = ['roles']
roles.head()
gender = pd.read_csv('datasets/moreno_crime/ent.moreno_crime_crime.person.sex', header=None)
gender.columns  = ["gender"]
gender.head()
5.2 Create Graph 
Below we are first joining the first dataframe with roles dataframe to create dataframe where we have a mapping from person to crime as well as the role of person involved. We'll then loop through rows of dataframe to generate a bipartite graph by adding nodes and edges to the graph. We are also adding a bipartite node attribute to a node to distinguish the set of nodes. We are also adding a role edge attribute which lets us know the role of a person in this crime.
bipartite_G = nx.Graph()

## Logic to add nodes and edges to graph with their metadata
for r, d in df.join(roles).iterrows():
    pid = 'P{0}'.format(d['PersonID'])  # pid = "Person I.D."
    cid = 'C{0}'.format(d['CrimeID'])  # cid = "Crime I.D."
    bipartite_G.add_node(pid, bipartite='person')
    bipartite_G.add_node(cid, bipartite='crime')
    bipartite_G.add_edge(pid, cid, role=d['roles'])

## Logic to add gender metadata to nodes
for idx in gender.index:
    nodeid = 'P{0}'.format(idx+1)
    bipartite_G.node[nodeid]['gender'] = gender.loc[idx]["gender"]
list(bipartite_G.nodes(data=True))[:5]
list(bipartite_G.edges(data=True))[:5]
5.3 Analyze Properties of Bipartite Graph 
Networkx has a module named bipartite which provides a list of methods to find out insights of bipartite graphs. We'll try to analyze the properties of bipartite graphs further below.
nx.bipartite.is_bipartite(bipartite_G)
Below we are looping through all nodes and trying to find out-degree centrality of all person nodes.
person_nodes = [node for node in bipartite_G.nodes() if bipartite_G.node[node]['bipartite'] == 'person']

person_nodes_with_centrality = [node for node in nx.bipartite.degree_centrality(bipartite_G, person_nodes).items() if node[0].startswith("P")]

sorted(person_nodes_with_centrality, key=lambda x: x[1], reverse=True)[:5]
Below we are looping through all nodes and trying to find out-degree centrality of all crime nodes.
crime_nodes = [node for node in bipartite_G.nodes() if bipartite_G.node[node]['bipartite'] == 'crime']


crime_nodes_with_centrality = [node for node in nx.bipartite.degree_centrality(bipartite_G, crime_nodes).items() if node[0].startswith("C")]

sorted(crime_nodes_with_centrality, key=lambda x: x[1], reverse=True)[:5]
5.4 Projections in Bipartite Graph 
We can project bipartite graph to one of the node-set of graph.
Below we'll be creating person-person projection of a person-crime bipartite graph where we'll put an edge between two person nodes related to same crime. We'll then plot it as a circos plot.
person_graph = nx.bipartite.projection.projected_graph(bipartite_G, person_nodes)

for n, d in person_graph.nodes(data=True):
    person_graph.node[n]['neighbors_count'] = len(list(person_graph.neighbors(n)))

c = CircosPlot(person_graph, node_color='gender', node_grouping='gender', node_order='neighbors_count')
c.draw()
![Network Analysis in Python: Important Structures and Bipartite Graphs [Networkx]](/static/tutorials/data_science/network-analysis-bipartite-11.jpg)
Below we'll be creating crime-crime projection of a person-crime bipartite graph where we'll put an edge between two crime nodes related to same person. We'll then plot it using circos plot to understand how crimes are related.
crime_graph = nx.bipartite.projection.projected_graph(bipartite_G, crime_nodes)

for n, d in crime_graph.nodes(data=True):
    crime_graph.node[n]['neighbors_count'] = len(list(crime_graph.neighbors(n)))

c = CircosPlot(crime_graph, node_color='neighbors_count', node_order='neighbors_count')
c.draw()
![Network Analysis in Python: Important Structures and Bipartite Graphs [Networkx]](/static/tutorials/data_science/network-analysis-bipartite-12.jpg)
This ends our small tutorial on basic graph analysis. We tried to cover below-mentioned points:
- Graph Definition.
- Cliques
- Triangles
- Connected Components
- Bipartite Graphs
Please feel free to let us know your views in the comments section.
References 
 Sunny Solanki
Sunny Solanki
Intro: Software Developer | Youtuber | Bonsai Enthusiast
About: Sunny Solanki holds a bachelor's degree in Information Technology (2006-2010) from L.D. College of Engineering. Post completion of his graduation, he has 8.5+ years of experience (2011-2019) in the IT Industry (TCS). His IT experience involves working on Python & Java Projects with US/Canada banking clients. Since 2020, he’s primarily concentrating on growing CoderzColumn.
His main areas of interest are AI, Machine Learning, Data Visualization, and Concurrent Programming. He has good hands-on with Python and its ecosystem libraries.
Apart from his tech life, he prefers reading biographies and autobiographies. And yes, he spends his leisure time taking care of his plants and a few pre-Bonsai trees.
Contact: sunny.2309@yahoo.in


![YouTube Subscribe]() Comfortable Learning through Video Tutorials?
Comfortable Learning through Video Tutorials?
If you are more comfortable learning through video tutorials then we would recommend that you subscribe to our YouTube channel.
![Need Help]() Stuck Somewhere? Need Help with Coding? Have Doubts About the Topic/Code?
Stuck Somewhere? Need Help with Coding? Have Doubts About the Topic/Code?
 Stuck Somewhere? Need Help with Coding? Have Doubts About the Topic/Code?
When going through coding examples, it's quite common to have doubts and errors.
If you have doubts about some code examples or are stuck somewhere when trying our code, send us an email at coderzcolumn07@gmail.com. We'll help you or point you in the direction where you can find a solution to your problem.
You can even send us a mail if you are trying something new and need guidance regarding coding. We'll try to respond as soon as possible.
![Share Views]() Want to Share Your Views? Have Any Suggestions?
Want to Share Your Views? Have Any Suggestions?
 Want to Share Your Views? Have Any Suggestions?
If you want to
- provide some suggestions on topic
- share your views
- include some details in tutorial
- suggest some new topics on which we should create tutorials/blogs
 network-analysis, networkx