Interactive Spreadsheet in Jupyter Notebook using ipysheet
Table of Contents
- Introduction
- 1. Basics
- 2. Calculations
- 3. Sheet from Dataframe/Numpy and vice-versa
- 4. Integrating Widgets into Sheet widget
- 5. Linking Sheet to Plot
- 6. Sheet Styling
- References
Introduction 
Jupyter notebook has been a preferred choice for data analysis by data scientists for a long time. It lets us present whole data analysis from data cleaning, interactive visualization, widgets and notes using markdown. Jupyter notebook can be used to prepare end to end report for explaining whole data analysis along with results. It's quite common that data is kept in excel or CSV files and it can be really helpful if we can present excel-like UI in jupyter notebook. Python has a library called ipysheet which can be used to represent an excel sheet in jupyter notebook as a widget. It supports the manipulation of a cell as well as calculations. It also lets us modify the look of cells and include ipywidgets. We'll try to explain the usage of ipywidgets by giving a few examples below. As ipysheet is also another widget, it can be easily linked with other widgets and visualization libraries as well. We suggest that you go through our tutorial on ipywidgets to learn about it which will help you with this tutorial.
Installation
conda install -c conda-forge ipysheet
1. Basics 
We'll start with simple sheet widget creation and then keep on building on it to explain further functionalities and options available in the library.
import pandas as pd
import numpy as np

import ipysheet

from ipysheet import sheet, cell
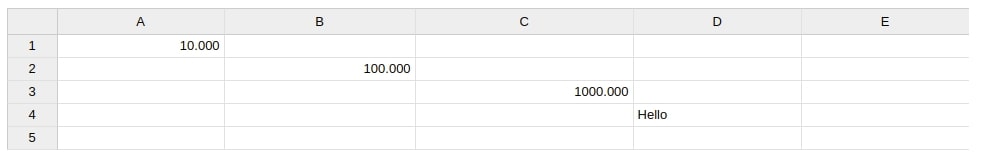
We are creating a simple sheet object which creates a sheet widget of 5 rows and 5 columns. Sheet widget created is interactive which lets us change the value of the cell as well. We can also call cell() method passing row, column and value for that cell and it'll reflect in that cell.
sheet1 = sheet()

cell(0,0,10);
cell(1,1,100);
cell(2,2,1000);
cell(3,3,"Hello");

sheet1
NOTE
Please make a note that we can change value of cells which we have declared using cell object. We won't be able to change other cells of sheet widget using interactivity.
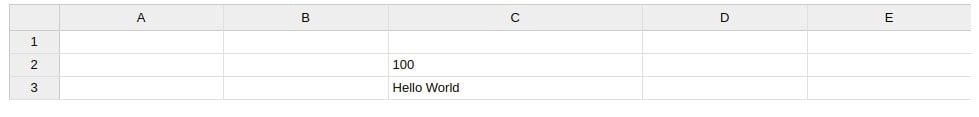
We can access all cell which has values by calling cells attribute of sheet object. We can even set this attribute passing list of cell objects and it'll override existing cells.
sheet1.cells
sheet2 = sheet(3,3)

sheet2.cells = [cell(2,2,"Hello World"), cell(1,2,"100")]

sheet2
from ipysheet import column, row
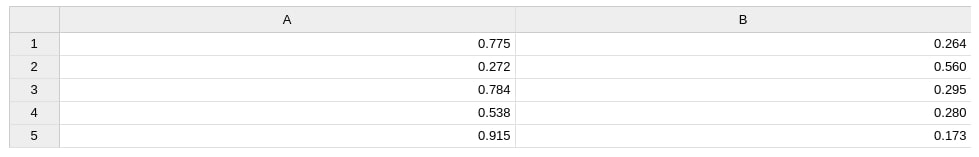
x = np.random.rand(5)
y = np.random.rand(5)

sheet3= sheet(rows=5,columns=2)

col1 = column(0,x)
col2 = column(1,y)

sheet3
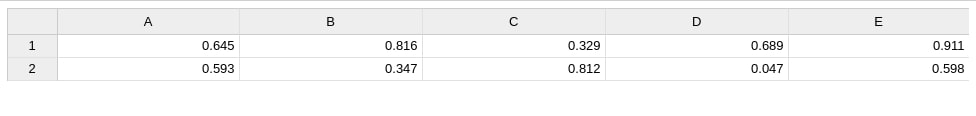
x = np.random.rand(5)
y = np.random.rand(5)

sheet4= sheet(rows=2,columns=5)

col1 = row(0,x)
col2 = row(1,y)

sheet4
2. Calculations 
We can even create functions that will be evaluated each time the value of a cell is changed and updates a cell to which function is linked. We can almost implement the same functionality as that of the excel sheet.
import ipywidgets as widgets
from ipysheet import calculation
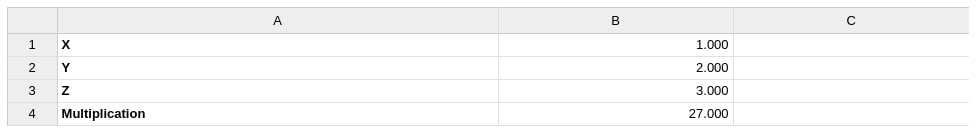
Below we have created a simple multiplication function based on three cells which sum up the first two cells and then rise to the power of the third cell.
sheet5 = sheet(rows=4, columns=3)

cell_x = cell(0, 1, 1, label_left='X')
cell_y = cell(1, 1, 2, label_left='Y')
cell_z = cell(2, 1, 3, label_left='Z')
cell_sum = cell(3, 1, 3, label_left='Multiplication', read_only=True)

@calculation(inputs=[cell_x, cell_y, cell_z], output=cell_sum)
def calculate(x, y, z):
    return (x + y)**z

sheet5
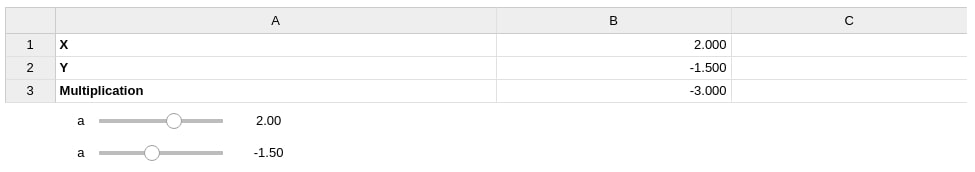
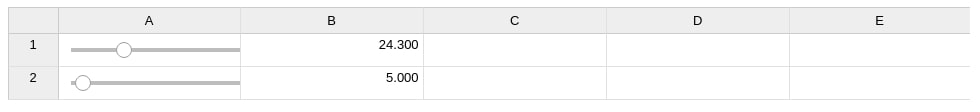
Another example below explains the calculation. We have also used sliders to change the value of cells so that we can test different values. We have used ipywidgets library to create sliders.
sheet6 = sheet(rows=3, columns=3)

cell_x = cell(0, 1, 2, label_left='X')
cell_y = cell(1, 1, 4, label_left='Y')
cell_sum = cell(2, 1, 3, label_left='Multiplication', read_only=True)

# create a slider linked to cell a
slider_x = widgets.FloatSlider(min=-10, max=10, description='a')
widgets.jslink((cell_x, 'value'), (slider_x, 'value'))

slider_y = widgets.FloatSlider(min=-10, max=10, description='a')
widgets.jslink((cell_y, 'value'), (slider_y, 'value'))

@calculation(inputs=[cell_x, cell_y], output=cell_sum)
def calculate(x, y):
    return x * y

widgets.VBox([sheet6, slider_x,slider_y])
3. Sheet from Dataframe/Numpy and vice-versa 
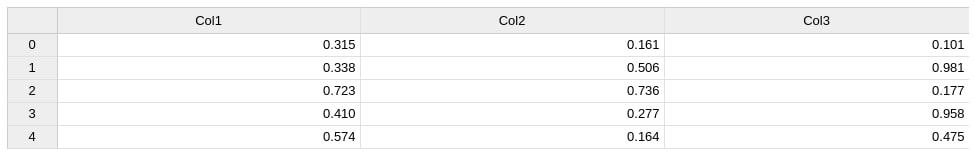
We can also create a sheet widget from the pandas dataframe as well as numpy 2D array as well. We can also create any of our sheet widget to pandas dataframe and numpy array. We'll explain below with few examples.
random_data = np.random.rand(5,3)

df = pd.DataFrame(random_data, columns=["Col1", "Col2", "Col3"])
df
sheet7 = ipysheet.from_dataframe(df)
sheet7
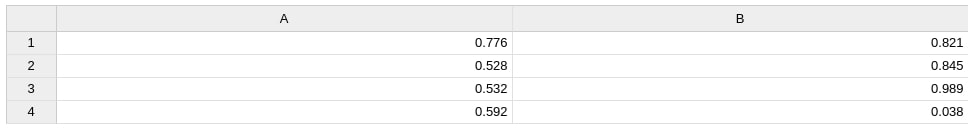
random_data = np.random.rand(4,2)

ipysheet.from_array(random_data)
ipysheet.to_array(sheet7)
ipysheet.to_dataframe(sheet7)
4. Integrating Widgets into Sheet widget 
We can also integrate other ipywidgets widgets into ipysheet cells. We'll explain it with a simple example where we include sliders into sheet cells.
sheet8 = sheet(2,2)

slider_1 = widgets.FloatSlider()
slider_2 = widgets.FloatSlider()

column1 = column(0, [slider_1, slider_2])

cell_1 = cell(0,1,1)
cell_2 = cell(1,1,5)

widgets.jslink((cell_1, "value"),(slider_1,"value"))
widgets.jslink((cell_2, "value"),(slider_2,"value"))

sheet8
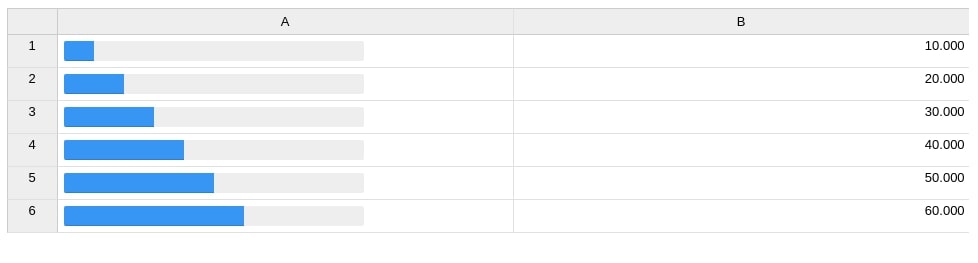
sheet9 = sheet(rows=6,columns=2)

prog_1 = widgets.IntProgress()
prog_2 = widgets.IntProgress()
prog_3 = widgets.IntProgress()
prog_4 = widgets.IntProgress()
prog_5 = widgets.IntProgress()
prog_6 = widgets.IntProgress()

column1 = column(0, [prog_1, prog_2, prog_3, prog_4, prog_5, prog_6])

cell11 = cell(0,1,10)
cell12 = cell(1,1,20)
cell13 = cell(2,1,30)
cell14 = cell(3,1,40)
cell15 = cell(4,1,50)
cell16 = cell(5,1,60)

widgets.jslink((cell11, "value"),(prog_1,"value"))
widgets.jslink((cell12, "value"),(prog_2,"value"))
widgets.jslink((cell13, "value"),(prog_3,"value"))
widgets.jslink((cell14, "value"),(prog_4,"value"))
widgets.jslink((cell15, "value"),(prog_5,"value"))
widgets.jslink((cell16, "value"),(prog_6,"value"))

sheet9
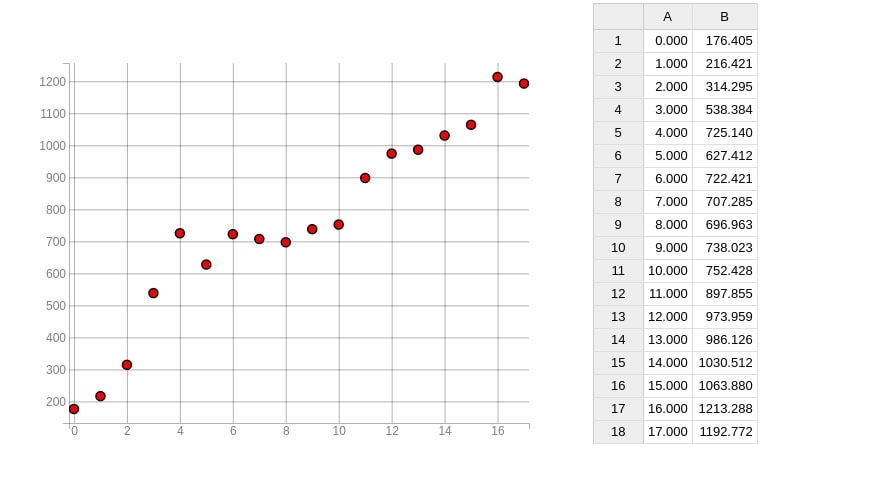
5. Linking Sheet to Plot 
We can also link sheets to plots. We have given below example of using the bqplot library which is also based on widgets where individual components of graphs are widgets hence linking becomes easy.
import numpy as np
from traitlets import link
import bqplot.pyplot as plt

size = 18
scale = 100.
np.random.seed(0)
x_data = np.arange(size)
y_data = np.cumsum(np.random.randn(size)  * scale)

fig = plt.figure()
fig.layout.width = '60%'

scatt = plt.scatter(x_data, y_data, colors=['red'], stroke='black')


sheet10 = sheet(rows=size, columns=2)

x_column = column(0, x_data)
y_column = column(1, y_data)

link((scatt, 'x'), (x_column, 'value'))
link((scatt, 'y'), (y_column, 'value'))

widgets.HBox((fig, sheet10))
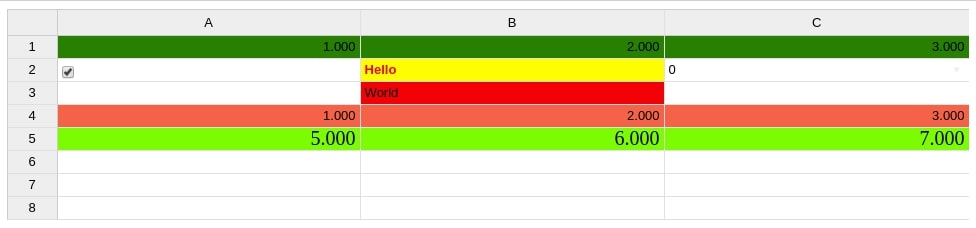
6. Sheet Styling 
We can highlight cell, change it's color, font style, font size, etc using various attributes available in cell(), row(), column() methods. We'll be exploring various parameter values. We'll also try various CSS values by passing them as dict to style parameter.
sheet11 = sheet(rows=8,columns=3)

cell(1,1,"Hello", color="red", background_color="yellow", font_style="times new roman", font_weight="bold")
cell(2,1,"World", color="black", background_color="red", font_style="times new roman")
cell(1,1,"Hello", color="red", background_color="yellow", font_style="times new roman", font_weight="bold")
cell(1,0,True)
cell(1,2,type="date")

row(0,value=[1,2,3], type="numeric",background_color="green")

row(3,value=[1,2,3], type="numeric",style={"background":"tomato"})

row(4,value=[5,6,7], type="numeric",style={"background":"lawngreen", "font-size":"2rem", "font-family":"aerial"})


sheet11
This ends our small tutorial on ipysheet (sheet widget library). Please feel free to let us know your views.
References 
 Sunny Solanki
Sunny Solanki
Intro: Software Developer | Youtuber | Bonsai Enthusiast
About: Sunny Solanki holds a bachelor's degree in Information Technology (2006-2010) from L.D. College of Engineering. Post completion of his graduation, he has 8.5+ years of experience (2011-2019) in the IT Industry (TCS). His IT experience involves working on Python & Java Projects with US/Canada banking clients. Since 2020, he’s primarily concentrating on growing CoderzColumn.
His main areas of interest are AI, Machine Learning, Data Visualization, and Concurrent Programming. He has good hands-on with Python and its ecosystem libraries.
Apart from his tech life, he prefers reading biographies and autobiographies. And yes, he spends his leisure time taking care of his plants and a few pre-Bonsai trees.
Contact: sunny.2309@yahoo.in


![YouTube Subscribe]() Comfortable Learning through Video Tutorials?
Comfortable Learning through Video Tutorials?
If you are more comfortable learning through video tutorials then we would recommend that you subscribe to our YouTube channel.
![Need Help]() Stuck Somewhere? Need Help with Coding? Have Doubts About the Topic/Code?
Stuck Somewhere? Need Help with Coding? Have Doubts About the Topic/Code?
 Stuck Somewhere? Need Help with Coding? Have Doubts About the Topic/Code?
When going through coding examples, it's quite common to have doubts and errors.
If you have doubts about some code examples or are stuck somewhere when trying our code, send us an email at coderzcolumn07@gmail.com. We'll help you or point you in the direction where you can find a solution to your problem.
You can even send us a mail if you are trying something new and need guidance regarding coding. We'll try to respond as soon as possible.
![Share Views]() Want to Share Your Views? Have Any Suggestions?
Want to Share Your Views? Have Any Suggestions?
 Want to Share Your Views? Have Any Suggestions?
If you want to
- provide some suggestions on topic
- share your views
- include some details in tutorial
- suggest some new topics on which we should create tutorials/blogs
 ipysheet, ipywidgets