Xarray is an open-source Python library that works almost like numpy but let us name dimensions of the array. Unlike numpy, where the majority of methods require us to specify axis argument to perform operations on a particular axis, xarray lets us specify string dimension names which can be more intuitive. This generally helps a lot when you are looking at your old codebase as operations based on axis won't give a better idea but operations based on some string dimension name will easily remind you of your coding decisions. Apart from dimension names, xarray also let us specify coordinates and attributes for arrays. The coordinates are just like pandas index but present for all dimensions of our array. The attributes are overall details about an array and are not associated with any dimension or coordinates.
Xarray provides two main data structures as a part of its API.
DataArray - This is numpy-like N-Dimensional Labelled array.
Dataset - This is a set of DataArray objects which can be worked together. All the DataArray in Dataset will have same dimensions and coordinates. When we perform any operation based on dimensions or coordinates then that operation will be performed on all DataArrays present in Dataset. This will become clear when we explain with examples.
As a part of this tutorial, we'll be primarily concentrating on Dataset data structure of xarray library. We have already covered DataArray data structure in detail in a separate tutorial. Please feel free to check it from the below link if you want to know about it in detail.
In this section, we'll explain various ways of creating xarray Dataset using different methods available from the API. We'll be using numpy for data creation purposes. We'll be using datasets created in this section in all of our upcoming sections to explain indexing and other methods of xarray API.
Below we have first set seed for numpy so that all random numbers generated after this code will be the same on different computers for reproducibility purposes.
np.random.seed(123)
The simplest way to create xarray Dataset is by using Dataset constructor available from the library.
Dataset(data_vars={}, coords={}, attrs={}) - This constructor accepts data give as dictionary to data_vars parameter, coordinates of dataset given as dictionary to coords parameter and attributes given as dictionary to attrs parameter. It then creates an instance of Dataset which is a multi-dimensional labeled array consisting of many DataArray instances that can be worked in parallel. Below, we have described how to provide values for parameters to this constructor.
The data_vars parameter accepts dictionary where keys of this dictionary are the name of the individual DataArray and values are tuples of the form (coordinates,data[,attributes]).
The coordinates can be a single string if there is only one dimension of input DataArray else it can be a tuple of strings specifying the dimension of N-dimensional DataArray.
The data can be numpy array, python lists, etc.
The attribute is an optional dictionary that can hold information about an individual DataArray.
The coords parameter accepts dictionary, where keys of the dictionary are dimension names and values are indexing values of those dimensions that we'll use to index Dataset. This dictionary can also create coordinates by combining a few dimensions of the dataset. We'll explain this through our examples below to make it more clear.
The attrs parameter accepts a dictionary which specifies attributes of Dataset holding some information about it.
Below we have created our first xarray Dataset. We have first created two numpy arrays of random numbers and the same shape. We have then given these arrays to Dataset constructor through the dictionary to parameter data_vars. We have given names of the arrays as dictionary keys and dictionary values are a combination of coordinates and data. As we have one-dimensional arrays, we can provide coordinates names as a single string. We have then specified coordinates by giving a dictionary to coords parameter. We have given a simple range that goes from 0-4 as the value of a single dimension of data. These values 0-4 will be coordinates to index Dataset in x dimension.
Below we have created another xarray Dataset using Dataset() constructor. This time we have provided two-dimensional arrays as data of our dataset. We have created both arrays using numpy. One of the arrays is an array of integers and another is an array of random floats in the range 0-1. This example shows that we can combine different kinds of data using Dataset.
As our arrays are two-dimensional, we'll have two dimensions in our data. We have declared dimensions as tuple (('x','y')) in dictionary provided to data_vars parameter of the constructor. The coords parameter is provided with a dictionary where we have simply used a range of integers to represent coordinates.
Below we have created another xaray Dataset which has almost the same code as our previous dataset with only a change in the coordinate values for both dimensions. We have provided a list of strings as coordinate values.
In the below cell, we have created another Dataset in which we have provided 3-dimensional arrays. We have specified three-dimension names as tuple (('x','y','z')). The coordinates values are simply a range of integers.
In the next cell, we have created a Dataset where we have created coordinate by combining two dimensions 'x' and 'y'.
Please make a NOTE of how we have provided value to 'index1' coordinate. The value of the dictionary is a tuple with two elements. The first element is again a tuple of two strings that specifies which dimensions it combines. The second value is an array that has the same shape as the combined shape of dimensions 'x' and 'y'. We have created an array of integers in the range 0-14 and reshaped them as (3,5) array to be used as a coordinate value. When we'll perform indexing on this dataset, value from 'index1' coordinates will be selected based on 'x' and 'y' dimension values used for indexing (E.g - x=0,y=0, index1=0, x=0:2, y=0:2, index1=0,1,3,4). This example explains how we can store some extra information inside of coordinates which can be useful to link more related data. This will become more clear when we explain our next example which is taken from real-life datasets.
In order to perform indexing on this Dataset, we'll still need to provide all three 'x,y, and z' dimensions. But we are storing extra details as 'index1' coordinate which can be a requirement in some situations. When we'll explain indexing/slicing datasets, it'll become more clear how coordinates with values different than normal integer indexing can be used to store more information.
Our next example explains the kind of dataset that we can face in real-life situations. It shows how we can combine a different kind of data with Dataset object.
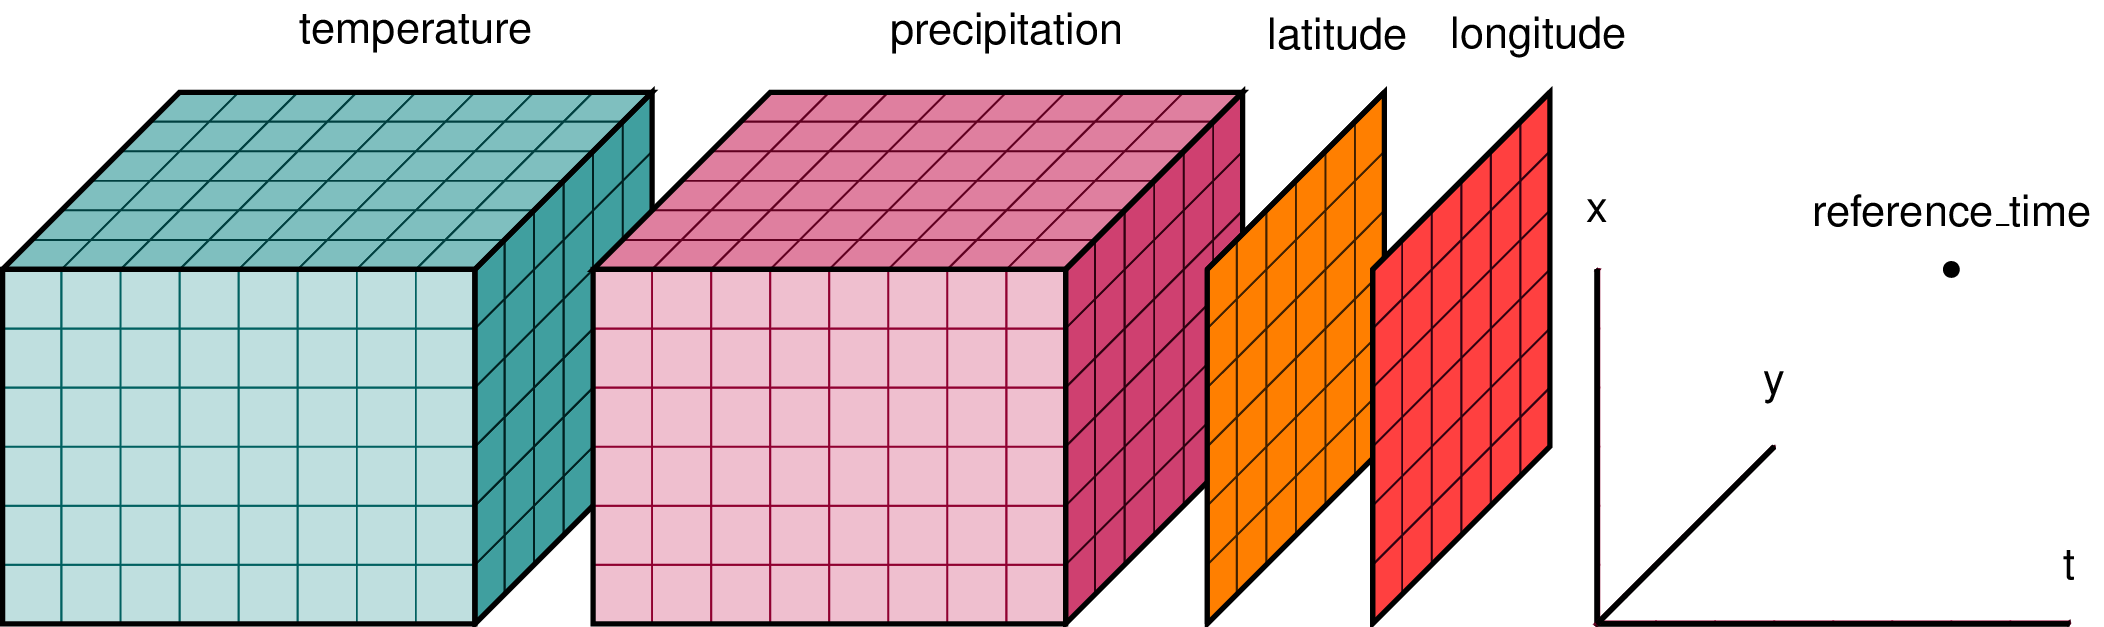
Our dataset consists of 6 different arrays of shape (3,5,7). They all represent measurements of different attributes which are used in weather forecasting.
The dataset has 3 dimensions which are named 'x,y and time'. All dimension names are specified in the dictionary given to data_vars parameter.
The dictionary is given to coords parameter creates two new coordinates named lon and lat which combines dimensions 'x and y'. The value of 'lon' coordinate is a tuple of two values where the first value is a tuple of two strings representing dimensions and the second value is an array of shape (3,5) representing coordinate values. The value of 'lat' coordinate follows the same structure. The 'time' dimension is used as it is to represent coordinates in that dimension. We have specified a list of seven dates as the value of time coordinate using pandas.date_range() function.
When we'll index our dataset by specifying values for 'x,y, and z' dimensions, we'll get unique measurements of temperature, humidity, pressure, wind speed, precipitation, and PM25 measured at a particular time and particular location (longitude, latitude). The location is represented using longitude and latitude which are specified as coordinates and not as part of the data dictionary provided to data_vars parameter.
Apart from data and coordinates, we have also specified attributes of the dataset first time. We have given a dictionary of strings to attrs parameter where we have specified more information explaining what the dataset holds and how to interpret coordinates and dimensions.
This example is inspired by the example present on xarray document hence below image taken from there can be helpful to understand how to look at Dataset to better understand it.
temperature=np.random.randint(1,100,size=(3,5,7))humidity=np.random.randn(3,5,7)pressure=np.random.randn(3,5,7)windspeed=np.random.randn(3,5,7)precitipation=np.random.randn(3,5,7)pm25=np.random.randn(3,5,7)dataset6=xr.Dataset(data_vars={"Temperature":(("x","y","time"),temperature),"Humidity":(("x","y","time"),humidity),"Pressure":(("x","y","time"),pressure),"WindSpeed":(("x","y","time"),windspeed),"Precipitation":(("x","y","time"),precitipation),"PM25":(("x","y","time"),pm25),},coords={"lon":(("x","y"),np.linspace(1,15,15).reshape(3,5)),"lat":(("x","y"),np.linspace(15,30,15).reshape(3,5)),"time":pd.date_range(start="2021-01-01",periods=7)},attrs={"Summary":"Dataset holds information like temperature, humidity. pressure, windspeed, precipitation and pm 2.5 particle presence based on location (lon, lat) and time.","lon":"Longitude","lat":"Latitude","time":"Date of Record"})dataset6
<xarray.Dataset>
Dimensions:        (x: 3, y: 5, time: 7)
Coordinates:
    lon            (x, y) float64 1.0 2.0 3.0 4.0 5.0 ... 12.0 13.0 14.0 15.0
    lat            (x, y) float64 15.0 16.07 17.14 18.21 ... 27.86 28.93 30.0
  * time           (time) datetime64[ns] 2021-01-01 2021-01-02 ... 2021-01-07
Dimensions without coordinates: x, y
Data variables:
    Temperature    (x, y, time) int64 82 3 36 70 38 65 83 ... 15 12 71 24 70 41
    Humidity       (x, y, time) float64 1.093 -0.8485 0.1826 ... -1.53 1.676
    Pressure       (x, y, time) float64 1.176 -1.544 -0.6974 ... -0.9302 -0.5022
    WindSpeed      (x, y, time) float64 0.07895 -0.1061 ... 0.2155 -1.026
    Precipitation  (x, y, time) float64 -0.5524 0.5605 0.3806 ... -0.7978 -1.678
    PM25           (x, y, time) float64 1.149 -1.045 ... 0.01034 -0.07389
Attributes:
    Summary:  Dataset holds information like temperature, humidity. pressure,...
    lon:      Longitude
    lat:      Latitude
    time:     Date of Record
Dataset holds information like temperature, humidity. pressure, windspeed, precipitation and pm 2.5 particle presence based on location (lon, lat) and time.
The ones_like() method works like its counterpart in numpy. It takes as input Dataset object and returns another Dataset object which has same dimensions as input Dataset but all values in the Dataset are replaced with 1s.
xr.ones_like(dataset6)
<xarray.Dataset>
Dimensions:        (x: 3, y: 5, time: 7)
Coordinates:
    lat            (x, y) float64 15.0 16.07 17.14 18.21 ... 27.86 28.93 30.0
    lon            (x, y) float64 1.0 2.0 3.0 4.0 5.0 ... 12.0 13.0 14.0 15.0
  * time           (time) datetime64[ns] 2021-01-01 2021-01-02 ... 2021-01-07
Dimensions without coordinates: x, y
Data variables:
    Temperature    (x, y, time) int64 1 1 1 1 1 1 1 1 1 1 ... 1 1 1 1 1 1 1 1 1
    Humidity       (x, y, time) float64 1.0 1.0 1.0 1.0 1.0 ... 1.0 1.0 1.0 1.0
    Pressure       (x, y, time) float64 1.0 1.0 1.0 1.0 1.0 ... 1.0 1.0 1.0 1.0
    WindSpeed      (x, y, time) float64 1.0 1.0 1.0 1.0 1.0 ... 1.0 1.0 1.0 1.0
    Precipitation  (x, y, time) float64 1.0 1.0 1.0 1.0 1.0 ... 1.0 1.0 1.0 1.0
    PM25           (x, y, time) float64 1.0 1.0 1.0 1.0 1.0 ... 1.0 1.0 1.0 1.0
Attributes:
    Summary:  Dataset holds information like temperature, humidity. pressure,...
    lon:      Longitude
    lat:      Latitude
    time:     Date of Record
Dataset holds information like temperature, humidity. pressure, windspeed, precipitation and pm 2.5 particle presence based on location (lon, lat) and time.
Dataset holds information like temperature, humidity. pressure, windspeed, precipitation and pm 2.5 particle presence based on location (lon, lat) and time.
The full_like() method takes as input Dataset object and another value. It then returns another Dataset object which has the same dimensions as input Dataset but all values are replaced with a value given as second input to the method.
xr.full_like(dataset6,101)
<xarray.Dataset>
Dimensions:        (x: 3, y: 5, time: 7)
Coordinates:
    lat            (x, y) float64 15.0 16.07 17.14 18.21 ... 27.86 28.93 30.0
    lon            (x, y) float64 1.0 2.0 3.0 4.0 5.0 ... 12.0 13.0 14.0 15.0
  * time           (time) datetime64[ns] 2021-01-01 2021-01-02 ... 2021-01-07
Dimensions without coordinates: x, y
Data variables:
    Temperature    (x, y, time) int64 101 101 101 101 101 ... 101 101 101 101
    Humidity       (x, y, time) float64 101.0 101.0 101.0 ... 101.0 101.0 101.0
    Pressure       (x, y, time) float64 101.0 101.0 101.0 ... 101.0 101.0 101.0
    WindSpeed      (x, y, time) float64 101.0 101.0 101.0 ... 101.0 101.0 101.0
    Precipitation  (x, y, time) float64 101.0 101.0 101.0 ... 101.0 101.0 101.0
    PM25           (x, y, time) float64 101.0 101.0 101.0 ... 101.0 101.0 101.0
Attributes:
    Summary:  Dataset holds information like temperature, humidity. pressure,...
    lon:      Longitude
    lat:      Latitude
    time:     Date of Record
Dataset holds information like temperature, humidity. pressure, windspeed, precipitation and pm 2.5 particle presence based on location (lon, lat) and time.
In this section, we'll explain a few useful attributes of Dataset objects and the information stored in them.
The attrs attribute returns dictionary of Dataset attributes.
dataset6.attrs
{'Summary': 'Dataset holds information like temperature, humidity. pressure, windspeed, precipitation and pm 2.5 particle presence based on location (lon, lat) and time.',
 'lon': 'Longitude',
 'lat': 'Latitude',
 'time': 'Date of Record'}
dataset6.attrs["Summary"]
'Dataset holds information like temperature, humidity. pressure, windspeed, precipitation and pm 2.5 particle presence based on location (lon, lat) and time.'
The coords attribute returns coordinates of the dataset. We can extract individual coordinates values by treating the output of coords attribute as a dictionary. Each individual coordinate is represented using xarray DataArray object.
In this section, we'll explain how we can index Dataset objects. We'll first explain how we can access and index individual DataArray from Dataset and then explain indexing of Dataset as a whole using sel() and isel() methods.
Please make a NOTE that all methods in this section return a new Dataset object based on indexing operation. It does not modify any Dataset object in place.
In this section, we'll explain how we can access individual DataArray and perform indexing on it. If you are interested in learning about indexing on DataArray in detail then please feel free to check our tutorial on it.
Below we have retrieved DataArray which is stored in our Dataset object by Array1 name. We can retrieve it by treating our Dataset object as dictionary-like.
We can also retrieve individual DataArray by calling its name as an attribute of Dataset object. The below statement will return the same result as our previous cell.
We can also use .loc property on our DataArray object just like pandas series/dataframe to retrieve a subset of an array by specifying actual index values which can be another data type than integer indexing.
In this section, we'll explain how we can use isel() method to index Dataset objects.
The isel() method let us use integer indexing to index our Dataset and provides two different ways to specify indexing details.
We can provide indexing details as if dimension names are parameters of isel() method. The parameter name can be the dimension name of Dataset and the parameter value can be a single integer or list of integers specifying index values for a particular dimension.
We can provide a dictionary where keys are dimension names and values are a list of integer indexes for a particular dimension.
Below we called isel() method on one of our Dataset object. We have treated dimension name 'x' of the Dataset object as parameter of isel() method and provided single index value to it. We have basically retrieved the 0th element from Dataset. This indexing will be applied on all DataArray and coordinates of Dataset. We can notice from the result that coordinates 'x' holds single value 0 and DataArray object 'Array1' and 'Array2' also holds single values which is 0th entry in both.
x=dataset1.isel(x=0)x
<xarray.Dataset>
Dimensions:  ()
Coordinates:
    x        int64 0
Data variables:
    Array1   float64 -1.086
    Array2   float64 1.651
xarray.Dataset
x
()
int64
0
array(0)
Array1
()
float64
-1.086
array(-1.0856306)
Array2
()
float64
1.651
array(1.65143654)
In the below cell, we have explained how we can provide indexing details to isel() method as a dictionary. The below method call will have the same impact as our previous cell.
x=dataset1.isel({"x":0})x
<xarray.Dataset>
Dimensions:  ()
Coordinates:
    x        int64 0
Data variables:
    Array1   float64 -1.086
    Array2   float64 1.651
xarray.Dataset
x
()
int64
0
array(0)
Array1
()
float64
-1.086
array(-1.0856306)
Array2
()
float64
1.651
array(1.65143654)
In the below cell, we have again called isel() on one of our Dataset objects. This time we have provided a list of integers as indexing values for dimension 'x' of our Dataset object. This will retrieve the first two elements from the Dataset. We can notice from the results how coordinate x is populated with the first two values and both DataArray objects 'Array1' and 'Array2' are populated with the first two values as per indexing details.
In the below cell, we have explained again how we can provide indexing details as a dictionary. The below method call will return the same results as our previous cell method call.
In the below cell, we have called isel() method on one of our Dataset objects which has two dimensions ('x and y'). We have asked it to select 0th and 1st values from dimension 'x' and 1st and 2nd values from dimension 'y'. It'll return a subset of our original Dataset based on these indexing details. We can notice from the results how 'x' and 'y' coordinate values are retrieved based on indexing. The DataArray objects 'Array1' and 'Array2' both holds 2x2 array.
In the below cell, we have explained indexing on our Dataset with 3 dimensions using isel() method. We have retrieved a subset of Dataset which consists of Dataset formed by first and second values from all three dimensions.
x=dataset4.isel(x=[0,1],y=[0,1],z=[0,1])x
<xarray.Dataset>
Dimensions:  (x: 2, y: 2, z: 2)
Coordinates:
  * x        (x) int64 0 1
  * y        (y) int64 0 1
  * z        (z) int64 0 1
Data variables:
    Array1   (x, y, z) int64 7 10 55 28 66 77 71 14
    Array2   (x, y, z) float64 1.013 0.2787 -0.5521 ... 0.2538 0.5539 -0.5307
In the below cell, we have again called isel() method on our Dataset which had details about temperature, humidity, pressure, etc. The dimension names in that Dataset were x, y, and time.
We can notice from the results that how a subset of coordinates and DataArray objects are retrieved based on indexing details given to the method.
x=dataset6.isel(x=[0,1],y=[0,1],time=[0,1])x
<xarray.Dataset>
Dimensions:        (x: 2, y: 2, time: 2)
Coordinates:
    lon            (x, y) float64 1.0 2.0 6.0 7.0
    lat            (x, y) float64 15.0 16.07 20.36 21.43
  * time           (time) datetime64[ns] 2021-01-01 2021-01-02
Dimensions without coordinates: x, y
Data variables:
    Temperature    (x, y, time) int64 82 3 38 28 51 28 93 28
    Humidity       (x, y, time) float64 1.093 -0.8485 2.097 ... 0.9206 -0.3255
    Pressure       (x, y, time) float64 1.176 -1.544 0.3667 ... 2.002 -0.2852
    WindSpeed      (x, y, time) float64 0.07895 -0.1061 ... -0.4384 0.07389
    Precipitation  (x, y, time) float64 -0.5524 0.5605 -1.196 ... 2.24 2.155
    PM25           (x, y, time) float64 1.149 -1.045 0.8266 ... -0.8372 2.127
Attributes:
    Summary:  Dataset holds information like temperature, humidity. pressure,...
    lon:      Longitude
    lat:      Latitude
    time:     Date of Record
Dataset holds information like temperature, humidity. pressure, windspeed, precipitation and pm 2.5 particle presence based on location (lon, lat) and time.
In this section, we have explained how we can use sel() method to perform indexing on our Dataset object.
The sel() method works exactly like isel() method but it accepts actual values of dimension to index Dataset object. The isel() method only accepts integer indexing values to index Dataset objects but sel() method accepts actual values of dimensions which can be of any data type (integer, string, datetime, etc).
Just like isel() method, it also lets us specify indexing details in two ways.
We can provide indexing details as if dimension names are parameters of sel() method. The parameter name can be the dimension name of Dataset and the parameter value can be a single dimension value or list of values specifying index values for a particular dimension.
We can provide a dictionary where keys are dimension names and values are a list of index values for a particular dimension.
Below we have used sel() method to retrieve a subset of one of our Dataset objects. The Dataset object used in this example had integers as values of dimensions hence integer indexing is used. When dimension values of Dataset is of type integers then isel() and sel() methods will work same. It's different when the data type of values of dimension is different.
In the below example, we have explained how we can provide indexing details as a dictionary to sel() method. The output of the below cell will be the same as our previous cell because the indexing details are the same.
In the below cell, we have tried to use sel() method to subset a Dataset object whose one dimension values are of type datetime. We have asked it to retrieve a subset of Dataset with a single date in time dimension.
Please make a NOTE how we provided datetime details as a string. We can provide datetime details as a string or original datetime type as well.
Then in the next few cells after the below cell, we have displayed coordinate and DataArray object detail of subset Dataset object that we got using sel() method.
x=dataset6.sel(x=0,y=0,time="2021-1-1")x
<xarray.Dataset>
Dimensions:        ()
Coordinates:
    lon            float64 1.0
    lat            float64 15.0
    time           datetime64[ns] 2021-01-01
Data variables:
    Temperature    int64 82
    Humidity       float64 1.093
    Pressure       float64 1.176
    WindSpeed      float64 0.07895
    Precipitation  float64 -0.5524
    PM25           float64 1.149
Attributes:
    Summary:  Dataset holds information like temperature, humidity. pressure,...
    lon:      Longitude
    lat:      Latitude
    time:     Date of Record
Dataset holds information like temperature, humidity. pressure, windspeed, precipitation and pm 2.5 particle presence based on location (lon, lat) and time.
lon :
Longitude
lat :
Latitude
time :
Date of Record
x.lon
<xarray.DataArray 'lon' ()>
array(1.)
Coordinates:
    lon      float64 1.0
    lat      float64 15.0
    time     datetime64[ns] 2021-01-01
In the below cell, we have created another example demonstrating usage of sel() method on Dataset whose one dimension values are of datetime type. This time we have provided a list of two strings specifying two different dates as values of time dimension inside sel() method function call.
Then in the next cell after the below cells, we have also displayed coordinate and DataArray object details of subset Dataset that we got through sel() method call.
Dataset holds information like temperature, humidity. pressure, windspeed, precipitation and pm 2.5 particle presence based on location (lon, lat) and time.
In the below cell, we have created another example demonstrating usage of sel() method on Dataset with datetime dimension. This time we have provided datetime values as a list of datetime type values created using pd.date_range() function. We can perform indexing on the dimension with datetime type values in this way as well.
Dataset holds information like temperature, humidity. pressure, windspeed, precipitation and pm 2.5 particle presence based on location (lon, lat) and time.
In this section, we'll explain commonly performing operations on Dataset objects like transpose, copy, change coordinate details, change attribute details, fill NaNs, add new attributes, etc. We'll explain various methods available from xarray to perform these operations.
Please make a NOTE that all methods in this section return a new Dataset object with details modified. It does not modify any Dataset object in place.
The assign() method lets us add new DataArray to our Dataset object. The method takes as input dictionary in the same format which we provide to Dataset() constructor to add new DataArray objects.
Below we have first created an array of random numbers with shape (3,5). We have then added this array to our Dataset object using assign() method. We have provided array name as key and value is a tuple of dimension names and actual data. We can add more than one DataArray to our Dataset object using this method.
The assign_attrs() method takes as input dictionary of attributes and adds those attributes to Dataset object. If attributes are already present in Dataset object then provided attributes will add/update attributes. If Dataset does not have attributes then attributes will be added to it.
The assign_coords() method let us update coordinates detail of Dataset object. It accepts dictionary specifying coordinate details just like we provide in Dataset() constructor when creating Dataset object.
In the below example, we have replaced the existing integer coordinates of Dataset object with a list of string coordinates.
In the next cell below, we have also tried to retrieve subset Dataset based on these new coordinate values.
The clip() method takes range specified as the minimum and maximum number. It then replaces all values which are less than minimum with minimum value and all values greater than maximum with maximum value. All values in the range are kept unchanged.
Below we have restricted values of our Dataset in the range (0.3, 0.6).
We can change data type of DataArray present in Dataset object using astype() method. It accepts python or numpy data types as input to specify the data type.
The fillna() method accepts single value as input and replaces all NaNs in Dataset object with that value. It'll replace NaN values present inside DataArray objects of our Dataset object.
We can easily drop DataArray objects from Dataset object using drop_vars() method. We need to provide a list of DataArray object names as input to the method and it'll return a new Dataset object with those DataArray objects removed.
Dataset holds information like temperature, humidity. pressure, windspeed, precipitation and pm 2.5 particle presence based on location (lon, lat) and time.
The drop_isel() method can be used to remove a subset of our Dataset object using integer indexing. It works exactly like isel() indexing method but it removes values that satisfy indexing details provided to it.
The method takes indexing details either as parameters of the method or as dictionary just-like isel() method.
Below we have dropped 0th value of dimension 'x', 0th & 1st value of dimension 'y' and 0th & 1st value of dimension 'time' of our dataset. This will then remove a subset of DataArray objects which satisfies these indexing details as well.
dataset6.drop_isel(x=[0,],y=[0,1],time=[0,1])
<xarray.Dataset>
Dimensions: (x: 2, y: 3, time: 5)
Coordinates:
lon (x, y) float64 8.0 9.0 10.0 13.0 14.0 15.0
lat (x, y) float64 22.5 23.57 24.64 27.86 28.93 30.0
* time (time) datetime64[ns] 2021-01-03 2021-01-04 ... 2021-01-07
Dimensions without coordinates: x, y
Data variables:
Temperature (x, y, time) int64 89 95 47 15 38 72 40 ... 68 12 71 24 70 41
Humidity (x, y, time) float64 1.367 0.8781 0.9098 ... -1.53 1.676
Pressure (x, y, time) float64 1.467 1.152 0.4269 ... -0.9302 -0.5022
WindSpeed (x, y, time) float64 -0.9625 0.2366 -0.1159 ... 0.2155 -1.026
Precipitation (x, y, time) float64 1.567 -1.071 1.241 ... -0.7978 -1.678
PM25 (x, y, time) float64 -0.167 0.6797 1.517 ... 0.01034 -0.07389
Attributes:
Summary: Dataset holds information like temperature, humidity. pressure,...
lon: Longitude
lat: Latitude
time: Date of Record
Dataset holds information like temperature, humidity. pressure, windspeed, precipitation and pm 2.5 particle presence based on location (lon, lat) and time.
lon :
Longitude
lat :
Latitude
time :
Date of Record
In the below cell, we have created an example which is a copy of our previous cell example with the only change that indexing details are provided as a dictionary.
Dataset holds information like temperature, humidity. pressure, windspeed, precipitation and pm 2.5 particle presence based on location (lon, lat) and time.
The drop_sel() method works exactly like drop_isel() method but it accepts indexing details where actual indexing values are provided instead of integer indexing. The actual indexing values can be of any data type like string, integer, float, datetime, etc.
The drop_sel() method is based on sel() indexing method but it removes entries which satisfies indexing details provided to it.
In the below cell, we have created another example demonstrating usage of drop_sel() method which explains how we can give indexing details as a dictionary. The indexing details are the same as our previous cell.
The isin() method takes an input array of elements. It then checks values of all DataArray objects and returns True/False based on the presence/absence of values in the given input array.
The map() function takes as input another function which takes as input a single value and returns the single value after performing some operation on the input value. The map() function applies input function on each value of all DataArray objects. It works exactly like apply() function of pandas.
Below we have multiplied all values by 10 using map() function.
In the below cell, we have again called map() method to multiply all values by 10 but this time we have also asked it explicitly to keep all Dataset attributes.
dataset6.map(lambdax:x*10,keep_attrs=True)
<xarray.Dataset>
Dimensions: (x: 3, y: 5, time: 7)
Coordinates:
lon (x, y) float64 1.0 2.0 3.0 4.0 5.0 ... 12.0 13.0 14.0 15.0
lat (x, y) float64 15.0 16.07 17.14 18.21 ... 27.86 28.93 30.0
* time (time) datetime64[ns] 2021-01-01 2021-01-02 ... 2021-01-07
Dimensions without coordinates: x, y
Data variables:
Temperature (x, y, time) int64 820 30 360 700 380 ... 120 710 240 700 410
Humidity (x, y, time) float64 10.93 -8.485 1.826 ... -15.3 16.76
Pressure (x, y, time) float64 11.76 -15.44 -6.974 ... -9.302 -5.022
WindSpeed (x, y, time) float64 0.7895 -1.061 -1.507 ... 2.155 -10.26
Precipitation (x, y, time) float64 -5.524 5.605 3.806 ... -7.978 -16.78
PM25 (x, y, time) float64 11.49 -10.45 -0.8036 ... 0.1034 -0.7389
Attributes:
Summary: Dataset holds information like temperature, humidity. pressure,...
lon: Longitude
lat: Latitude
time: Date of Record
Dataset holds information like temperature, humidity. pressure, windspeed, precipitation and pm 2.5 particle presence based on location (lon, lat) and time.
Dataset holds information like temperature, humidity. pressure, windspeed, precipitation and pm 2.5 particle presence based on location (lon, lat) and time.
The query() works exactly like query() method of pandas dataframe. It let us specify python expressions as input to the method to perform filtering on Dataset object. We need to provide expressions for each dimension separately.
If you want to know about how query() method works with pandas dataframe with examples then please feel free to check our tutorial on the same.
Below we have asked to keep only dimension values that are greater than 0.5 for dimension 'x' and values that are greater than 1.5 for dimension 'y' of our dataset. The returned Dataset object will have dimension values that satisfy input conditions.
The info() function returns information about our Dataset object like data type, dimension details, etc.
dataset6.info()
xarray.Dataset {
dimensions:
x = 3 ;
y = 5 ;
time = 7 ;
variables:
int64 Temperature(x, y, time) ;
float64 Humidity(x, y, time) ;
float64 Pressure(x, y, time) ;
float64 WindSpeed(x, y, time) ;
float64 Precipitation(x, y, time) ;
float64 PM25(x, y, time) ;
float64 lon(x, y) ;
float64 lat(x, y) ;
datetime64[ns] time(time) ;
// global attributes:
:Summary = Dataset holds information like temperature, humidity. pressure, windspeed, precipitation and pm 2.5 particle presence based on location (lon, lat) and time. ;
:lon = Longitude ;
:lat = Latitude ;
:time = Date of Record ;
}
dataset3.info()
xarray.Dataset {
dimensions:
x = 3 ;
y = 5 ;
variables:
int64 Array1(x, y) ;
float64 Array2(x, y) ;
<U2 x(x) ;
<U2 y(y) ;
// global attributes:
}
In this section, we'll explain how we can perform simple statistics like min, max, mean, standard deviation, variance, rolling window functions, etc on Dataset object.
Please make a NOTE that all methods in this section return a new Dataset object based on the operation. It does not modify any Dataset object in place.
The min() method let us find minimum element for each DataArray objects of our Dataset object. It even let us provide dimension name if we want to retrieve minimum at a particular dimension of our Dataset.
The argmin() method let us find index of minimum element for each DataArray objects of our Dataset object. We can also provide dimension names to retrieve minimum element indices at a particular dimension.
The max() method helps us find maximum element for each DataArray object of our Dataset object. We can also provide dimension names if we want maximum at a particular dimension.
The sum() method returns sum of all elements for each DataArray objects of our Dataset object. We can provide dimension name as argument if we want sum at a particular dimension of our data.
The mean() method returns average of all elements for each DataArray objects of our Dataset object. We can provide dimension names as an argument if we want the mean at a particular dimension of our data.
The median() method returns median for each DataArray objects of our Dataset object. We can provide dimension names as an argument if we want a median at a particular dimension of our data.
The std() method returns standard deviation of all elements for each DataArray objects of our Dataset object. We can provide dimension names as arguments if we want standard deviation at a particular dimension of our data.
The var() method returns variance for each DataArray objects of our Dataset object. We can provide dimension names as arguments if we want variance at a particular dimension of our data.
The rolling() method lets us perform rolling window functions on each DataArray objects of our Dataset object. It accepts dimension names at which to apply rolling window and window size as input. We can provide dimension name and window size as a dictionary or as if they are parameters of the method. We can perform various aggregate functions (like min, max, mean, std, var, etc) on a rolling object returned by rolling() method.
Below we have taken the rolling window function on our 'y' dimension with a window size of 2. We have then calculated the mean aggregate function on samples of each window.
If you want to know how to perform moving window functions in pandas then please feel free to check our tutorial on the same where we cover the topic in detail.
Below we have created another example demonstrating usage of rolling() function. This time we have performed a rolling window on 'time' dimension with a window size of 5. We have then applied the mean aggregate function on samples of each window.
<xarray.Dataset>
Dimensions: (x: 3, y: 5, time: 7)
Coordinates:
lon (x, y) float64 1.0 2.0 3.0 4.0 5.0 ... 12.0 13.0 14.0 15.0
lat (x, y) float64 15.0 16.07 17.14 18.21 ... 27.86 28.93 30.0
* time (time) datetime64[ns] 2021-01-01 2021-01-02 ... 2021-01-07
Dimensions without coordinates: x, y
Data variables:
Temperature (x, y, time) float64 nan nan nan nan ... nan 29.4 38.4 43.6
Humidity (x, y, time) float64 nan nan nan ... 0.3481 0.07248 0.2177
Pressure (x, y, time) float64 nan nan nan ... 0.01627 -0.08065 -0.1145
WindSpeed (x, y, time) float64 nan nan nan ... -0.962 -0.7011 -0.8333
Precipitation (x, y, time) float64 nan nan nan ... 0.08676 -0.05186 -0.3082
PM25 (x, y, time) float64 nan nan nan ... -0.7342 -0.4395 -0.4752
Attributes:
Summary: Dataset holds information like temperature, humidity. pressure,...
lon: Longitude
lat: Latitude
time: Date of Record
Dataset holds information like temperature, humidity. pressure, windspeed, precipitation and pm 2.5 particle presence based on location (lon, lat) and time.
The resample() function is useful when one of the dimensions of our Dataset object is datetime and we want to change the existing frequency of that dimension. The frequency can be changed in two ways using resample() function.
Up Sampling - We increase frequency from lower to higher. E.g - Daily frequency to monthly.
Down Sampling - We decrease frequency. E.g - Daily to 6 hourly.
The resample() function takes as input dimension name and new frequency as input. We can provide dimension name and frequency as a dictionary or as if they are parameters of the resample() method.
If you are interested in learning about resampling using pandas then please feel free to check our tutorial where we discuss resampling in detail.
Below we have upsampled our Dataset from daily frequency to 2-day frequency for 'time' dimension. After upsampling, we have called mean() function on upsampled Dataset to replace values with an average of values.
In this example, we have down sampled our Dataset from daily frequency to 12-hourly freqeuncy. Down sampling generally introdues NaN/Null entries in dataset because we have new datetime entries in dataset which were not present earlier. We can fill NaN/Null entries using xarray functions like fillna(), ffill(), bfill(), etc.
After downsampling, we have taken an average of resampled entries.
This ends our small tutorial explaining how we can use Dataset data structure available from xarray library. Please feel free to let us know your views in the comments section.
About: Sunny Solanki holds a bachelor's degree in Information Technology (2006-2010) from L.D. College of Engineering. Post completion of his graduation, he has 8.5+ years of experience (2011-2019) in the IT Industry (TCS). His IT experience involves working on Python & Java Projects with US/Canada banking clients. Since 2020, he’s primarily concentrating on growing CoderzColumn.
His main areas of interest are AI, Machine Learning, Data Visualization, and Concurrent Programming. He has good hands-on with Python and its ecosystem libraries.
Apart from his tech life, he prefers reading biographies and autobiographies. And yes, he spends his leisure time taking care of his plants and a few pre-Bonsai trees.
Contact: sunny.2309@yahoo.in
Comfortable Learning through Video Tutorials?
If you are more comfortable learning through video tutorials then we would recommend that you subscribe to our YouTube channel.
Stuck Somewhere? Need Help with Coding? Have Doubts About the Topic/Code?
When going through coding examples, it's quite common to have doubts and errors.
If you have doubts about some code examples or are stuck somewhere when trying our code, send us an email at coderzcolumn07@gmail.com. We'll help you or point you in the direction where you can find a solution to your problem.
You can even send us a mail if you are trying something new and need guidance regarding coding. We'll try to respond as soon as possible.
Want to Share Your Views? Have Any Suggestions?
If you want to
provide some suggestions on topic
share your views
include some details in tutorial
suggest some new topics on which we should create tutorials/blogs
Please feel free to contact us at coderzcolumn07@gmail.com.
We appreciate and value your feedbacks. You can also support us with a small contribution by clicking DONATE.
 Sunny Solanki


 Stuck Somewhere? Need Help with Coding? Have Doubts About the Topic/Code?
 Want to Share Your Views? Have Any Suggestions?
 xarray-dataset